Neostapfia colusana (Colusa Grass)
Visual overview of genome assembly metrics
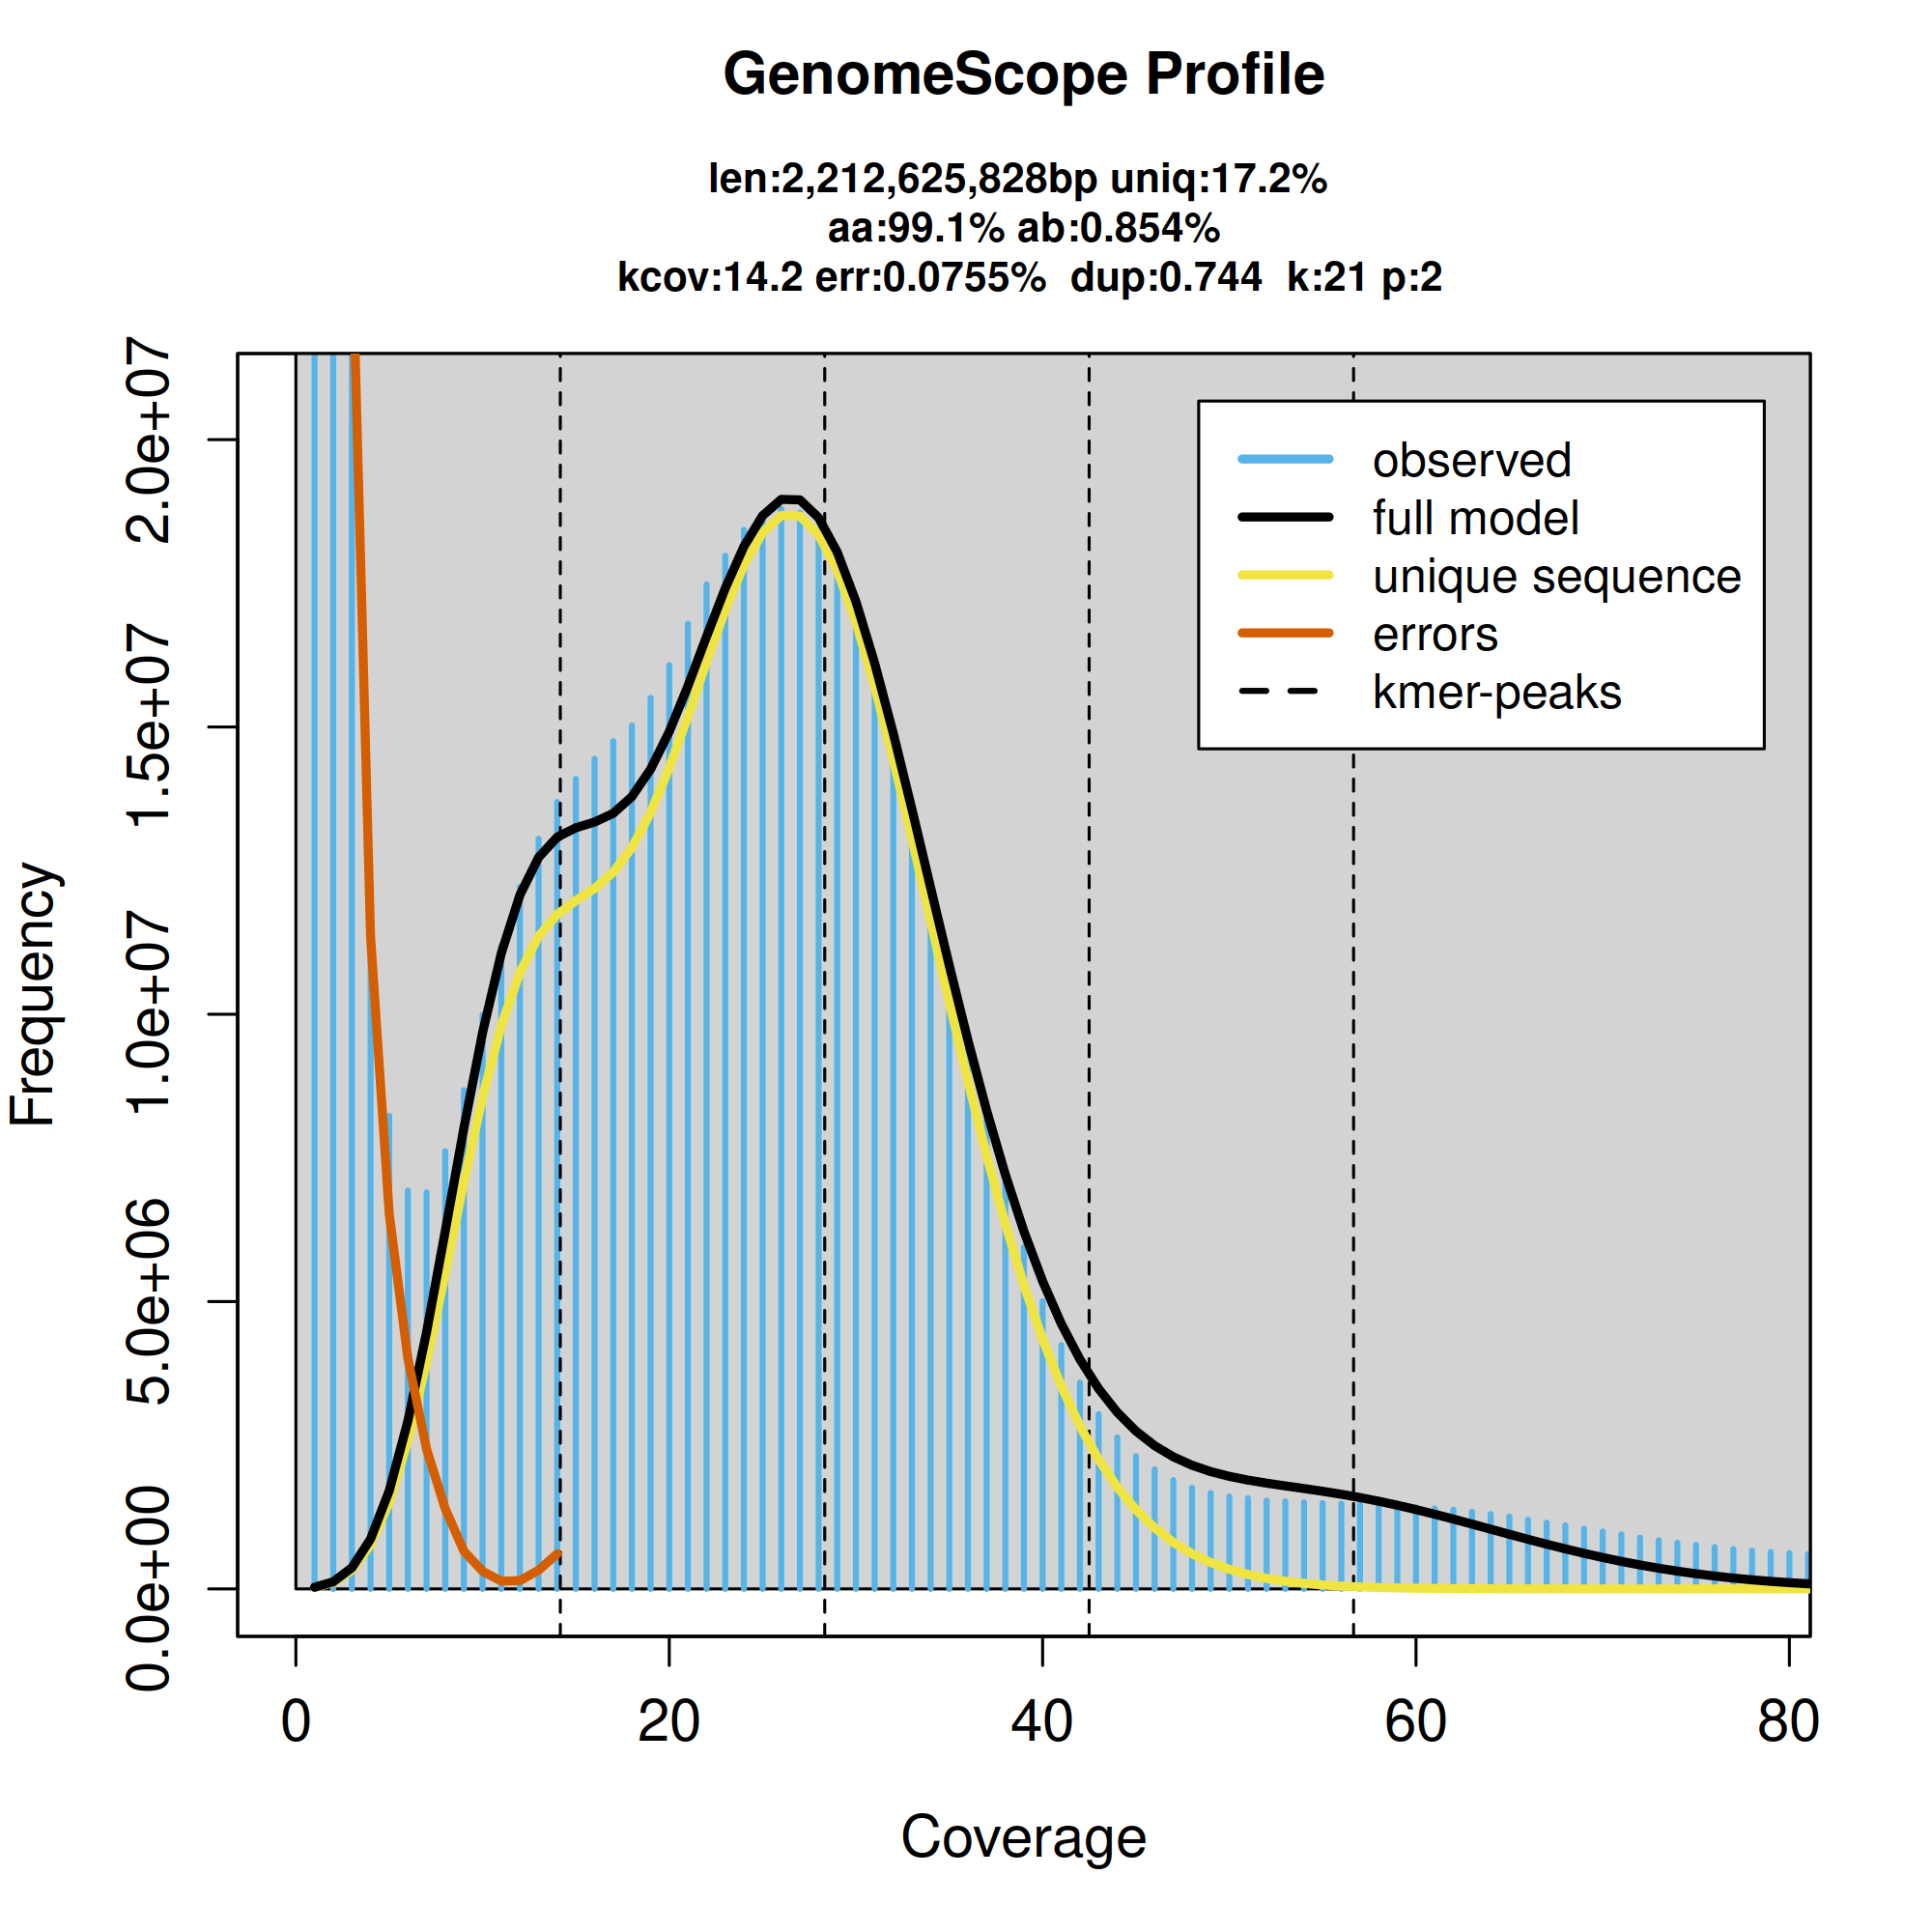
K-mer frequency distribution as a function of coverage. Horizontal bars represent the observed k-mer frequencies, while the curved lines show the GenomeScope model fit and the contributions of unique sequences and sequencing errors. Vertical dashed lines mark estimated k-mer coverage peaks.
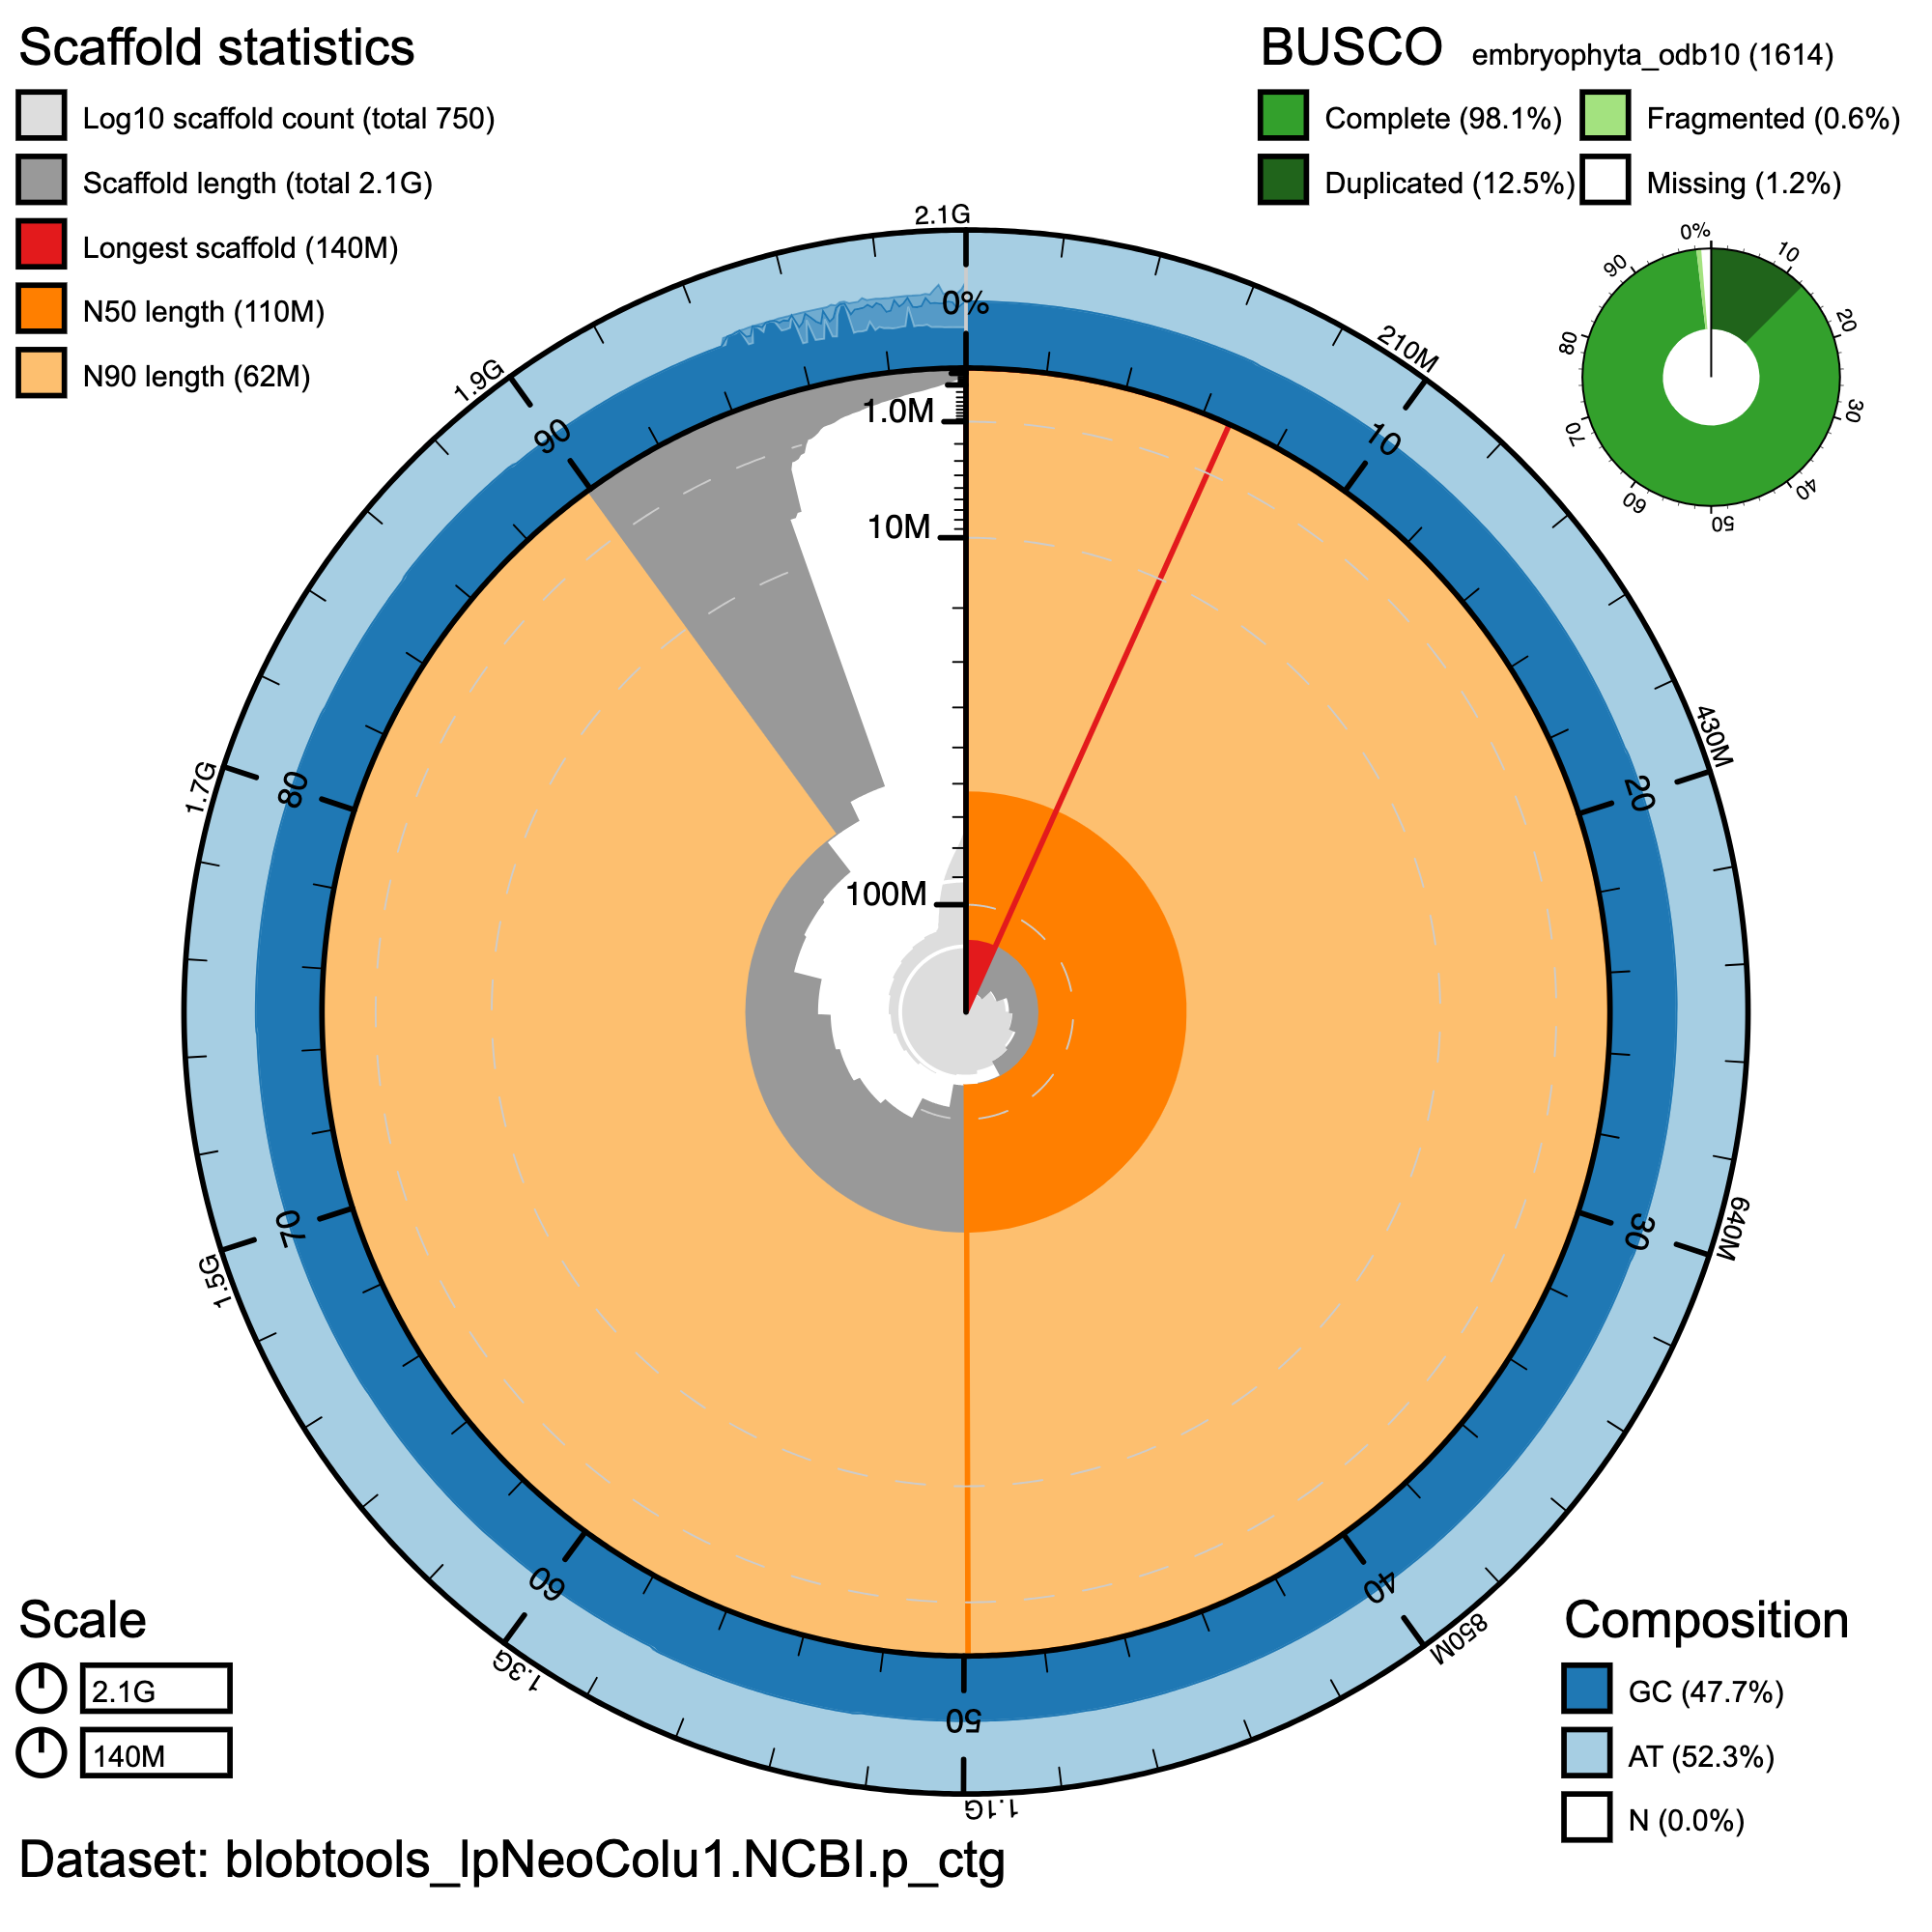
Summary assembly metrics for haplotype 1 assembly: The circular plot presents scaffold statistics, with scaffold lengths and scaffold counts (log10 scale). Outer rings show GC content (47.7%) and AT content (52.3%), with no ambiguous bases (N). The BUSCO assessment (inset) indicates high assembly completeness.
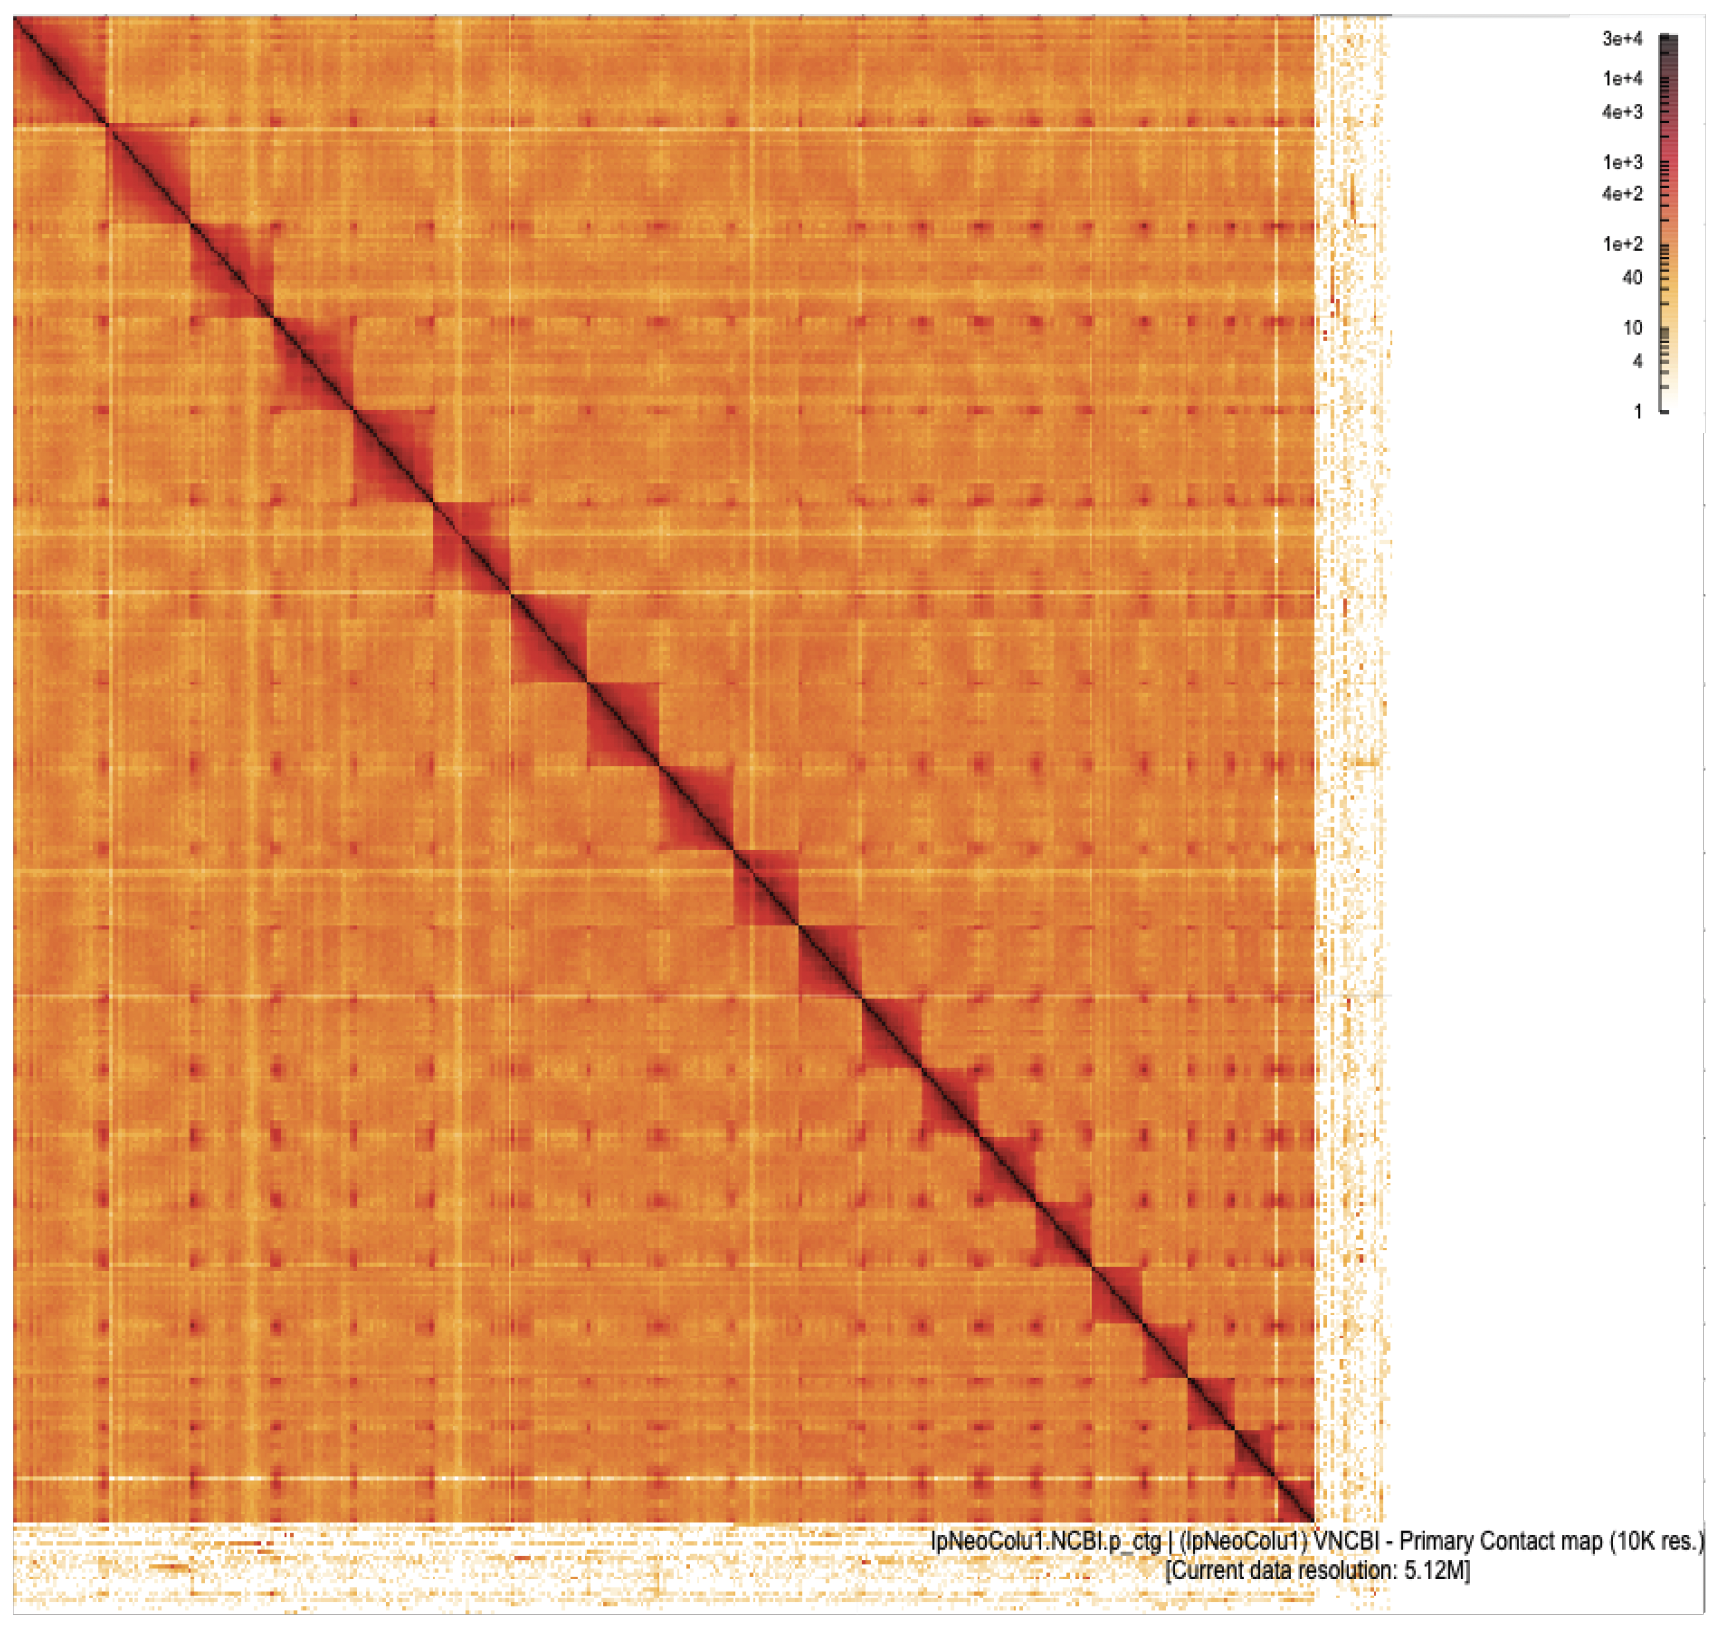
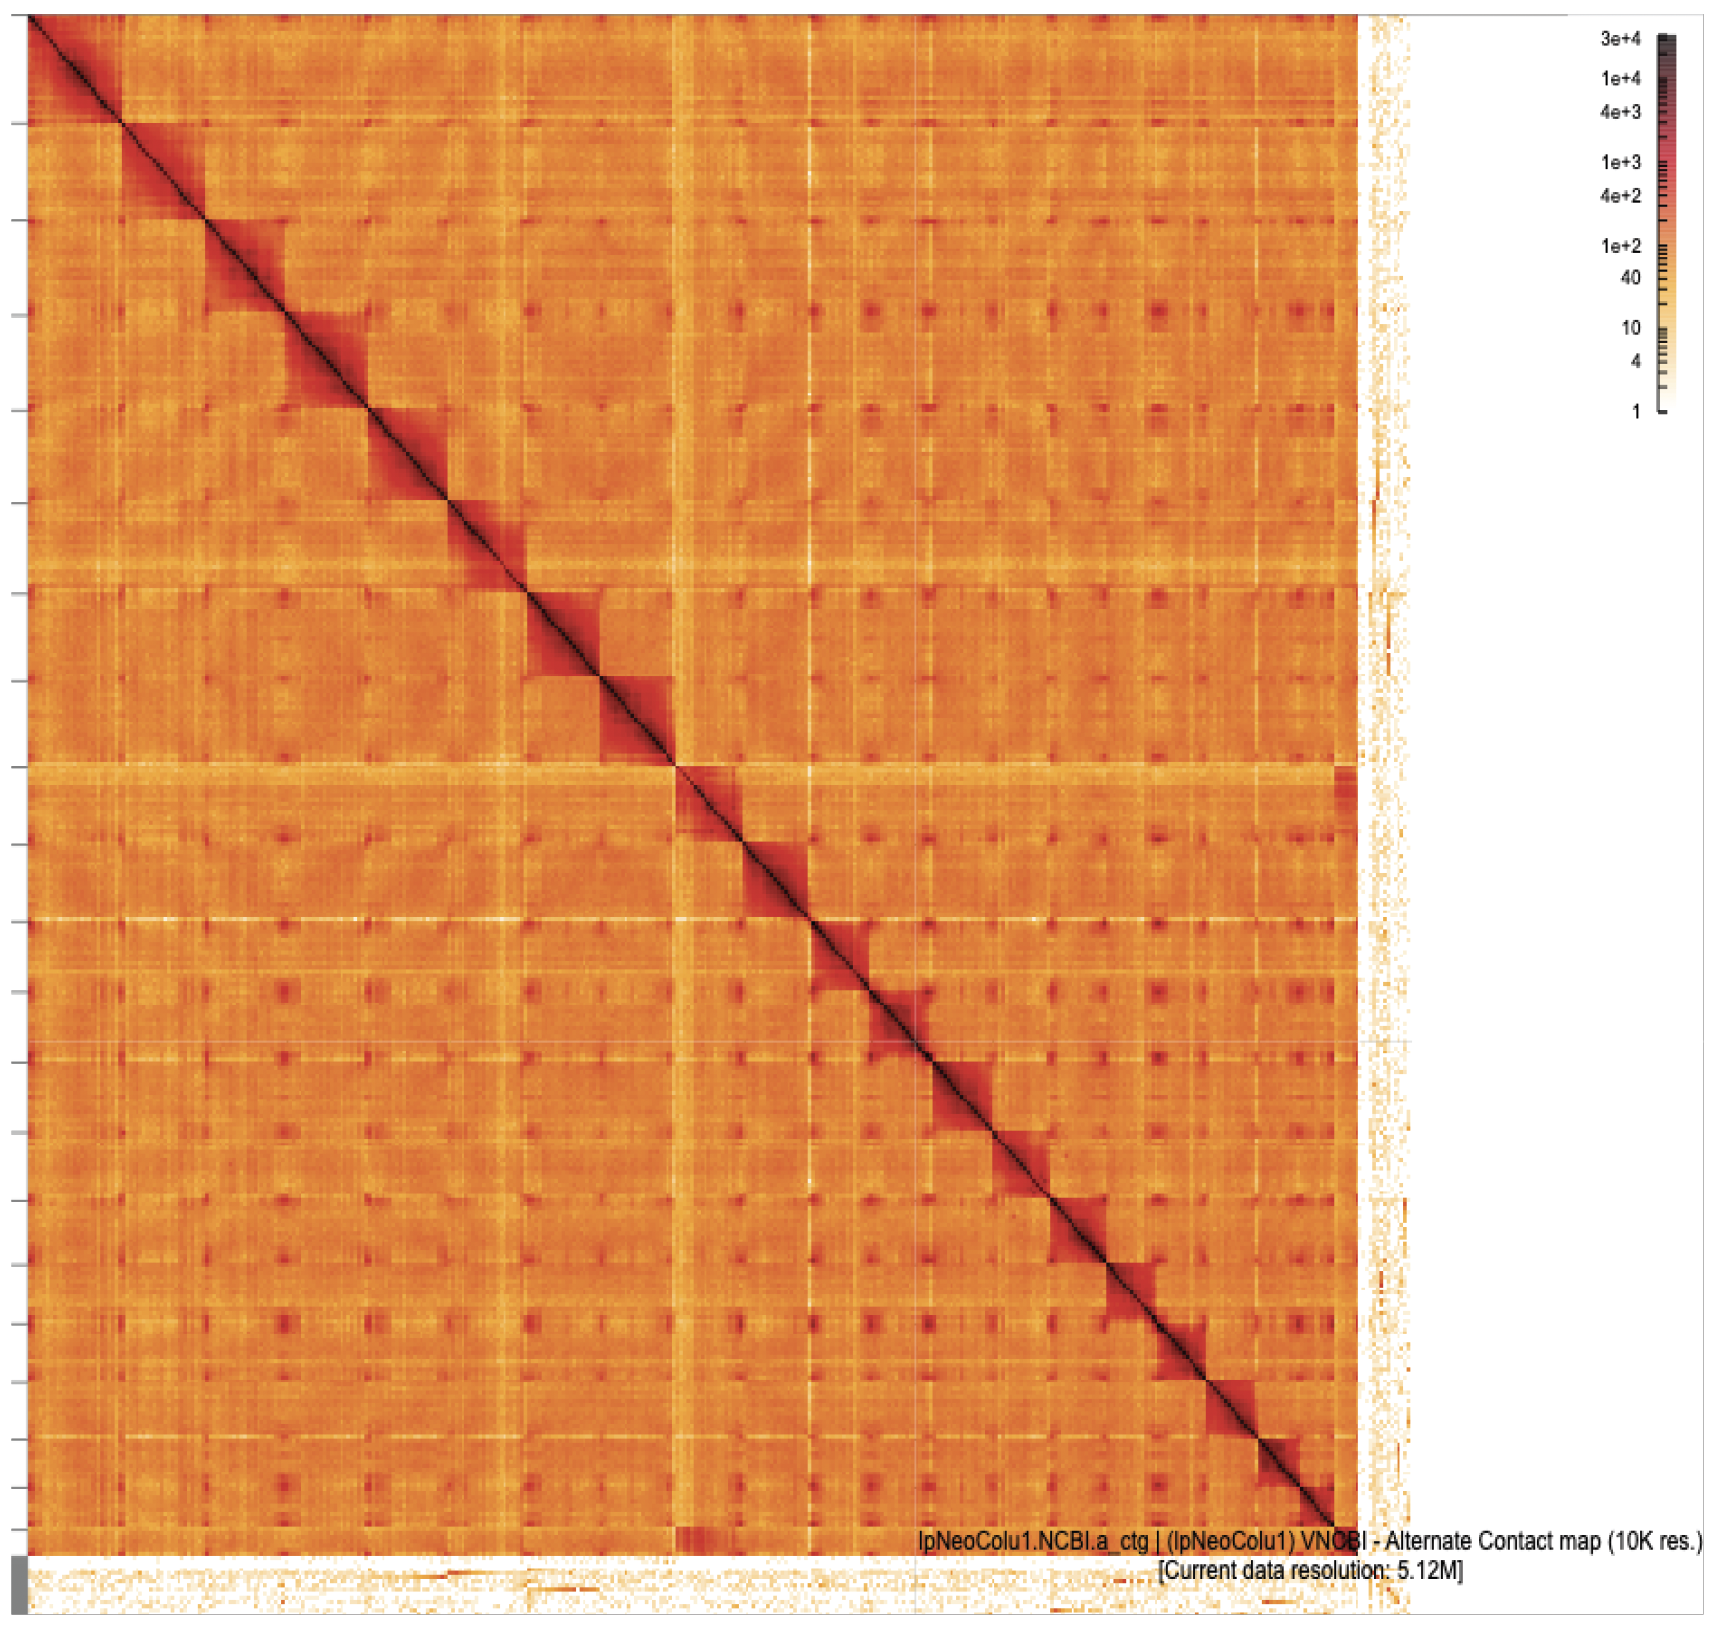
Omni-C interaction heatmaps are shown for haplotype 1 (left) and haplotype 2 (right) assemblies at 10 kb resolution, visualized at a current resolution of 5.12 mb. Each heatmap reflects chromatin interaction frequency, with darker shades representing higher contact intensity. Strong diagonal patterns and distinct chromosomal interaction blocks indicate well-assembled, chromosome-scale scaffolds. The maps support the structural integrity of both assemblies and highlight the continuity and organization of genomic regions in the lpNeoColu1 genome.
Authors
Lillie K Pennington, Merly Escalona, Daniel J Toews, Noravit Chumchim, Robert Cooper, Colin W Fairbairn, Mohan P A Marimuthu, Courtney Miller, Oanh H Nguyen, Dannise Ruiz-Ramos, William E Seligmann, Molly Stephens, Erin Toffelmier, H Bradley Shaffer, Rachel S Meyer, Jason P Sexton