Sebastes paucispinis (California Bocaccio)
Visual overview of genome assembly metrics
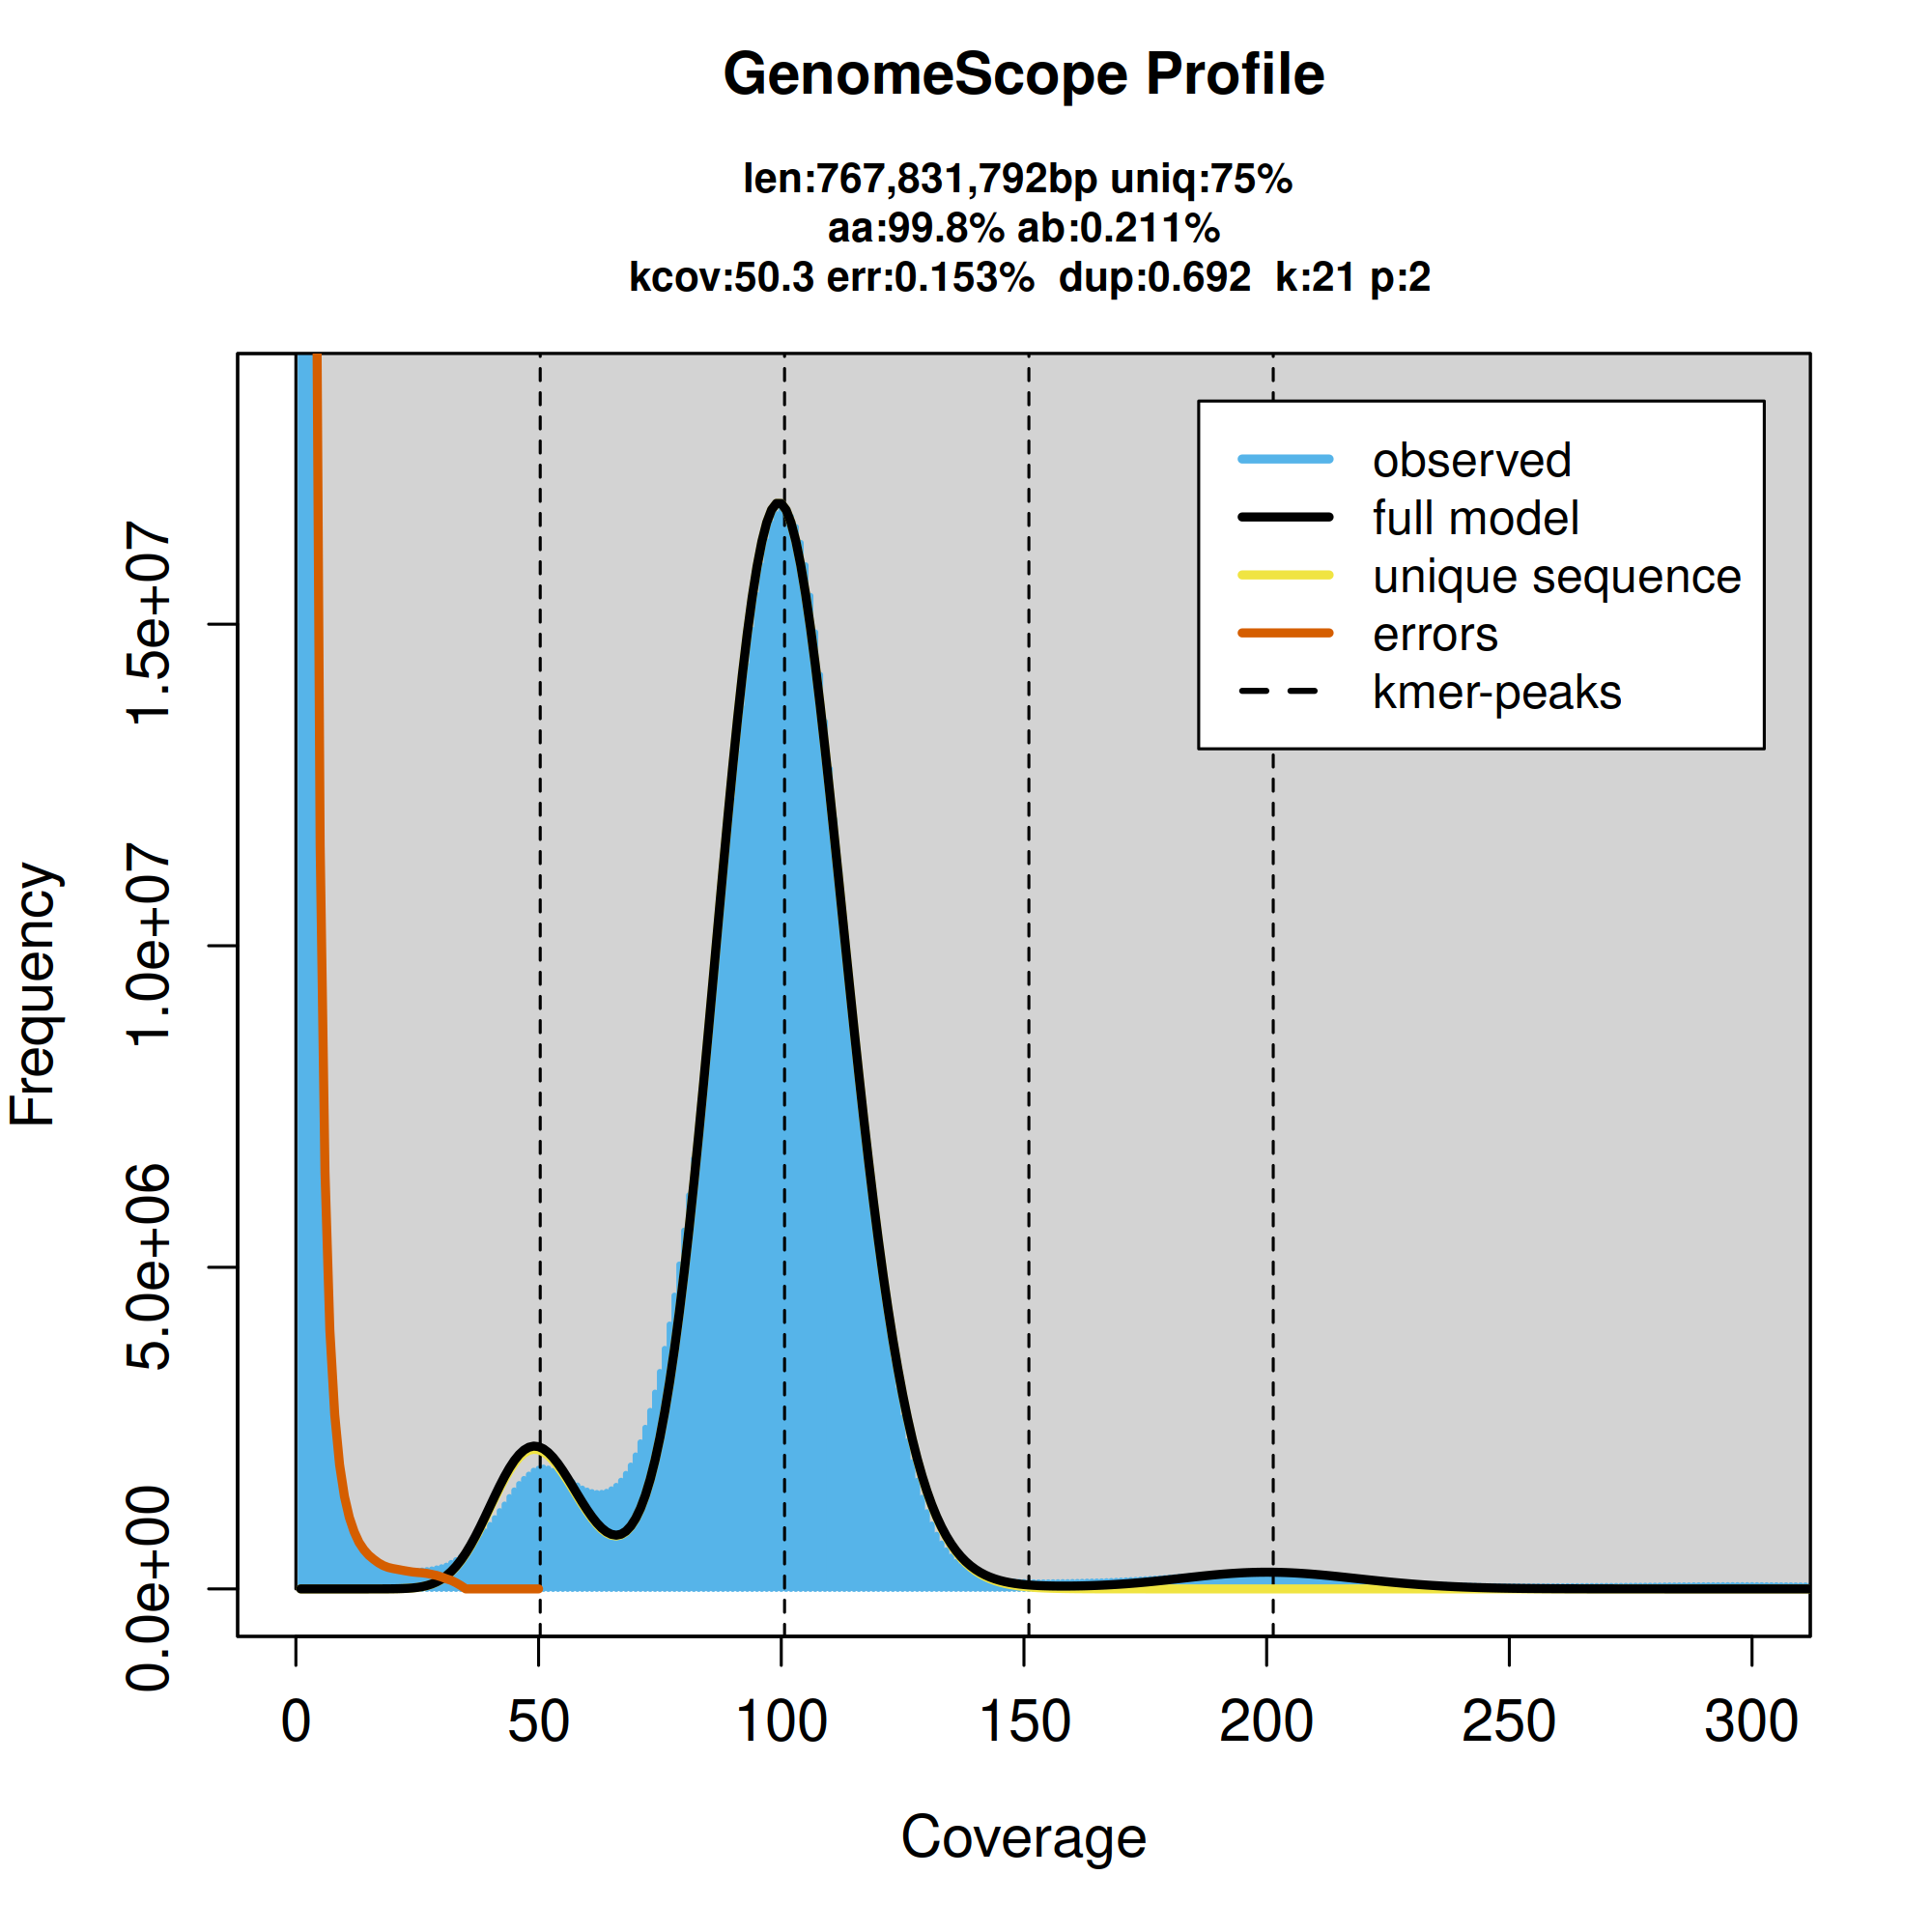
A k-mer-based analysis of genome size and duplication level run using GenomeScope
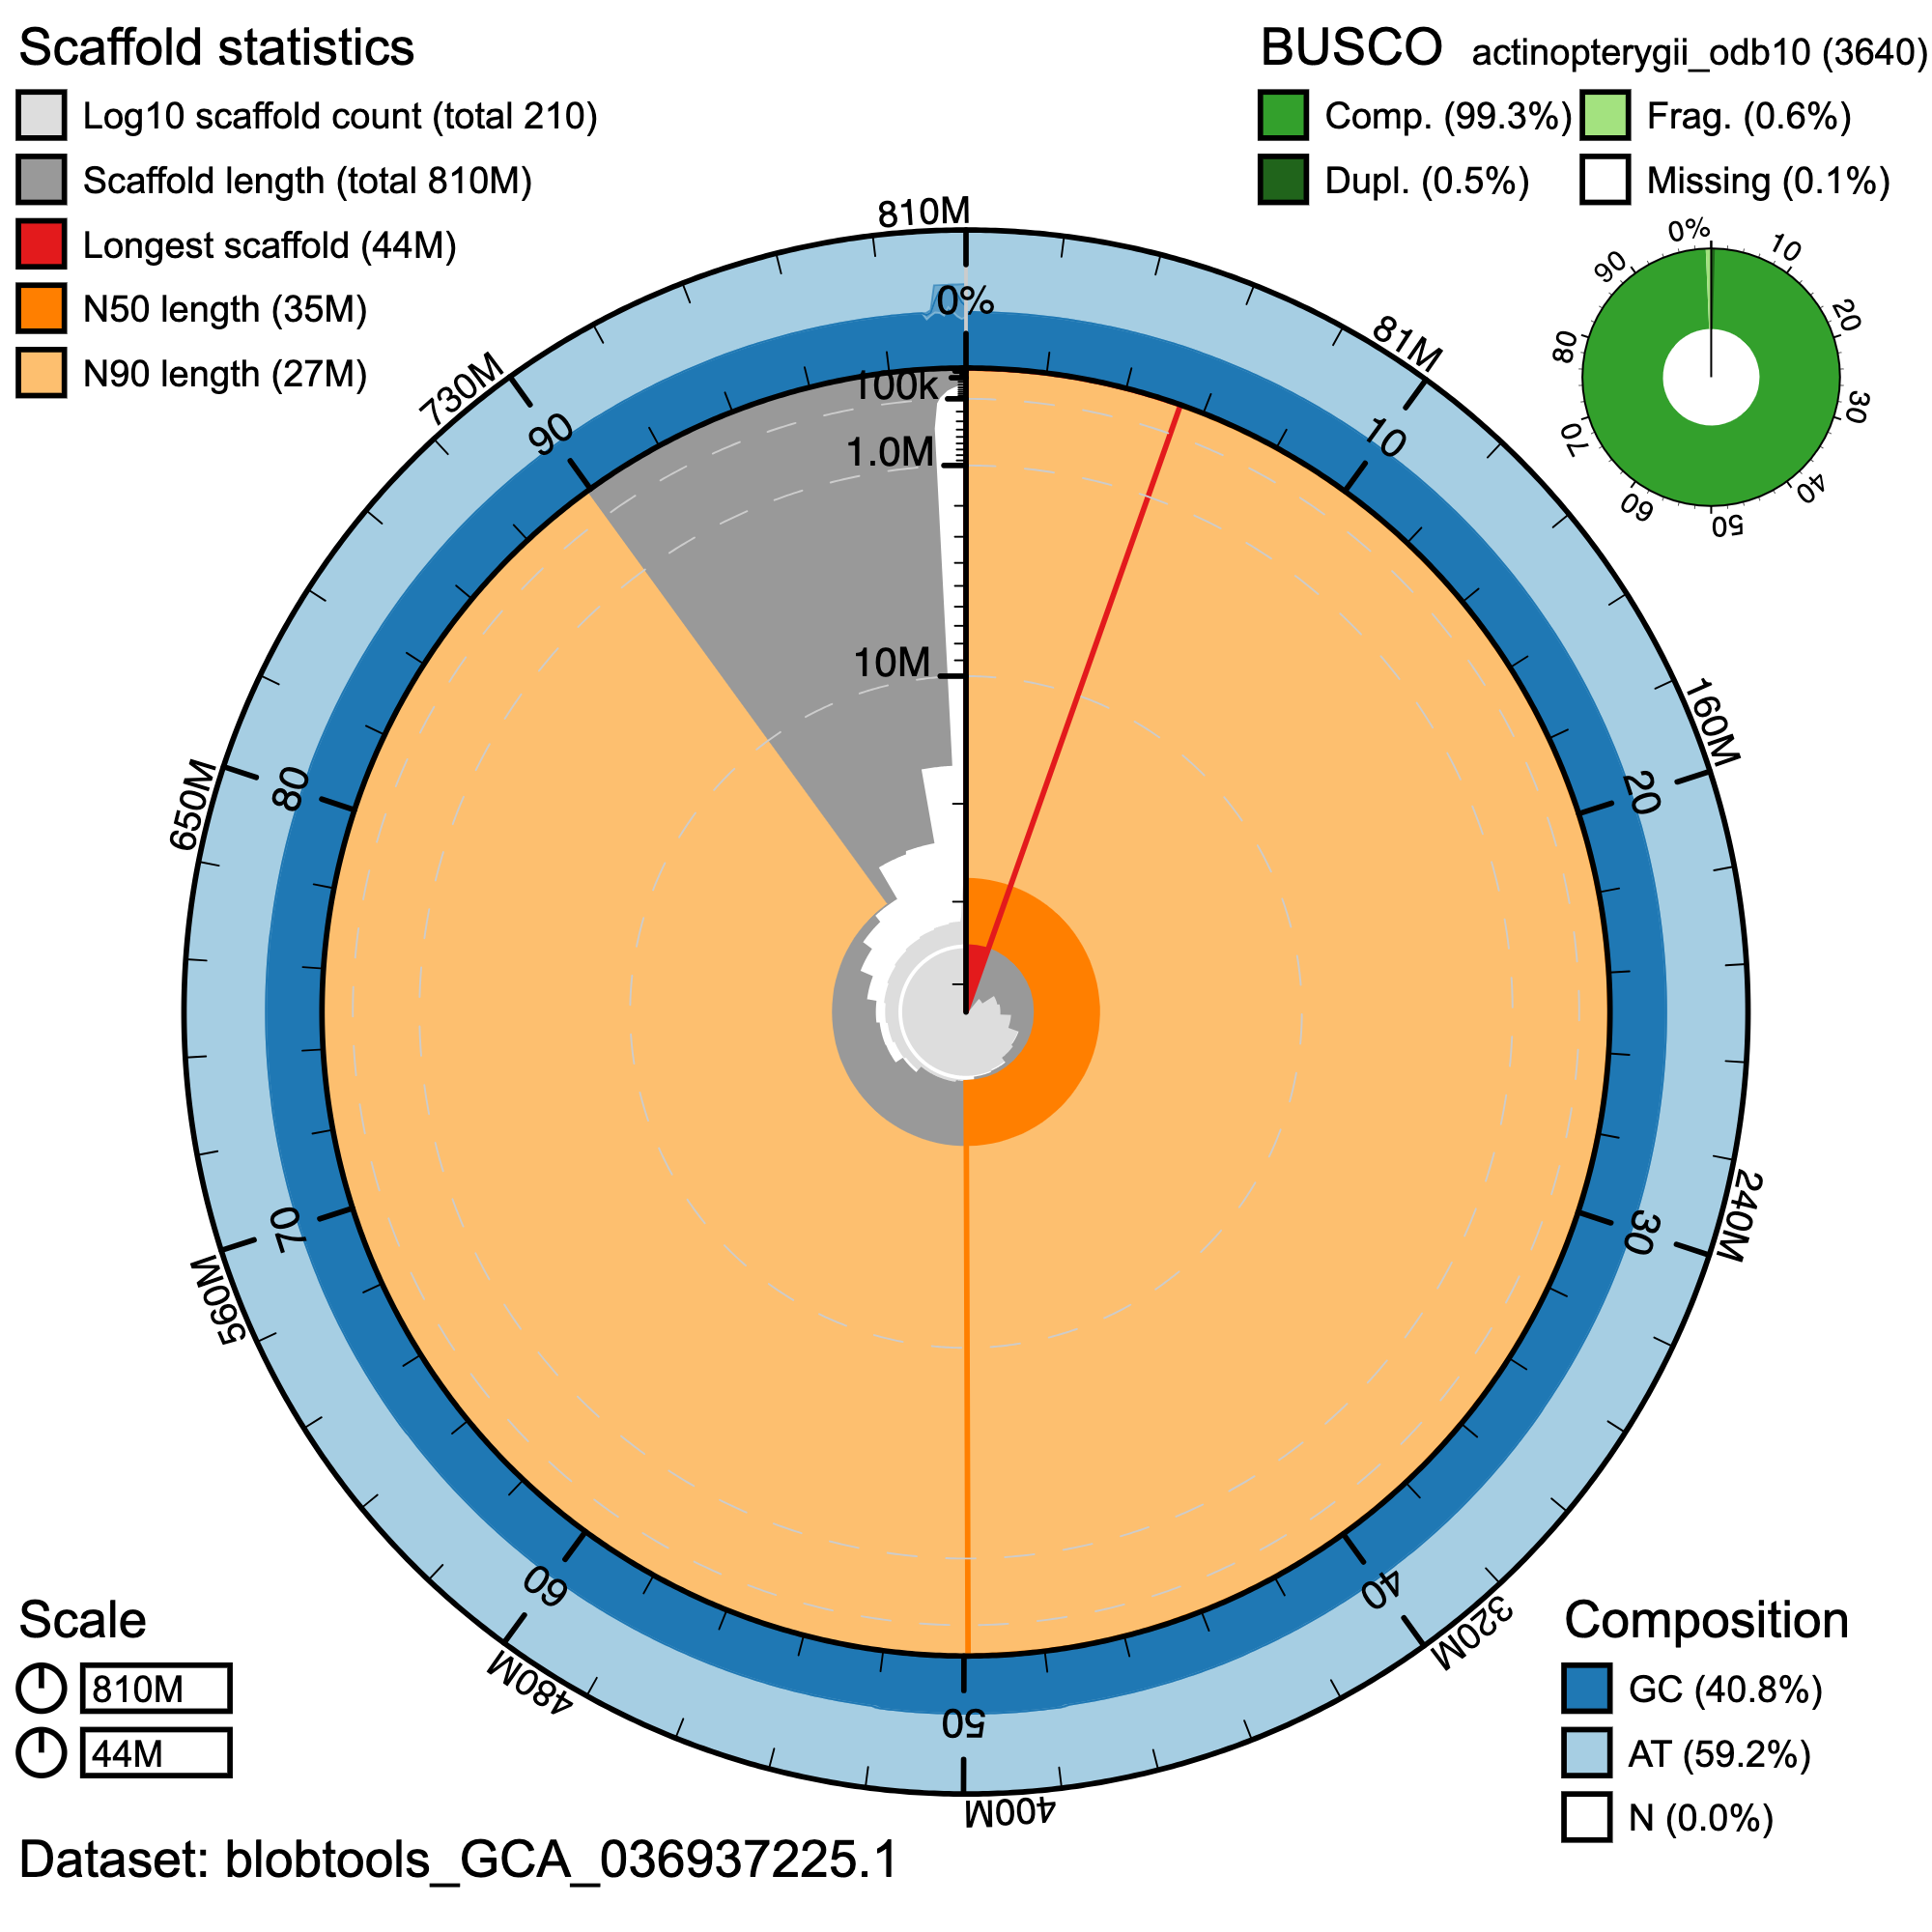
BlobToolKit Snail plot of the S. paucispinis assembly fSebPau1.0.hap1 illustrating assembly summary statistics. The full outer circle represents the entirety of the assembly. From the center of the snail plot, the red line indicates the length of the longest scaffold in the assembly, scaffolds are represented in grey and arranged in ascending length order clockwise around the plot. Light and dark orange sections of the plot represent the N90 and N50 values of the assembly, respectively, and light and dark blue regions on the outer edge of the plot represent AT and GC content, respectively.
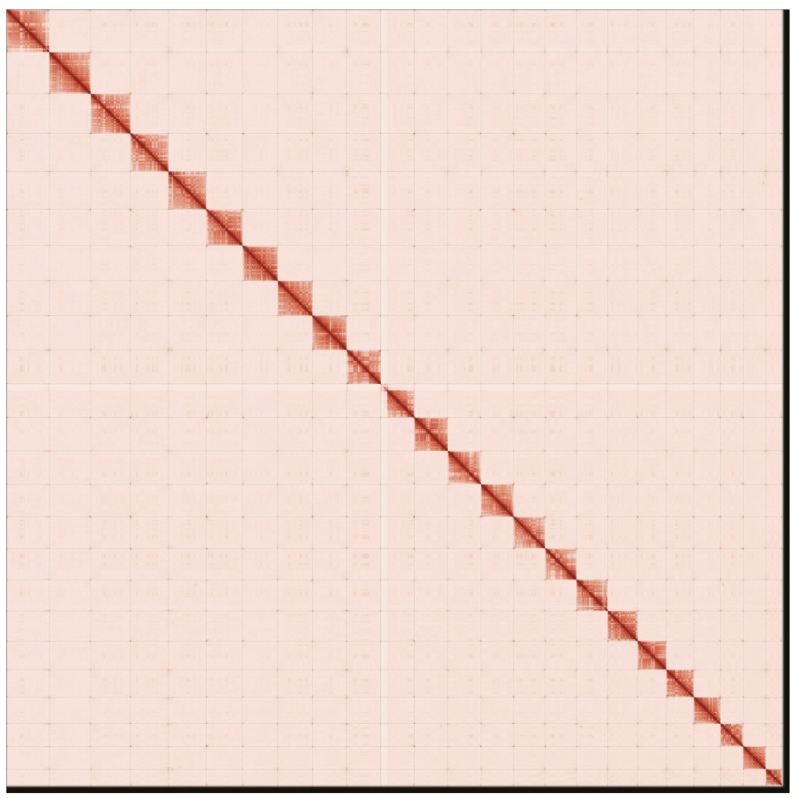
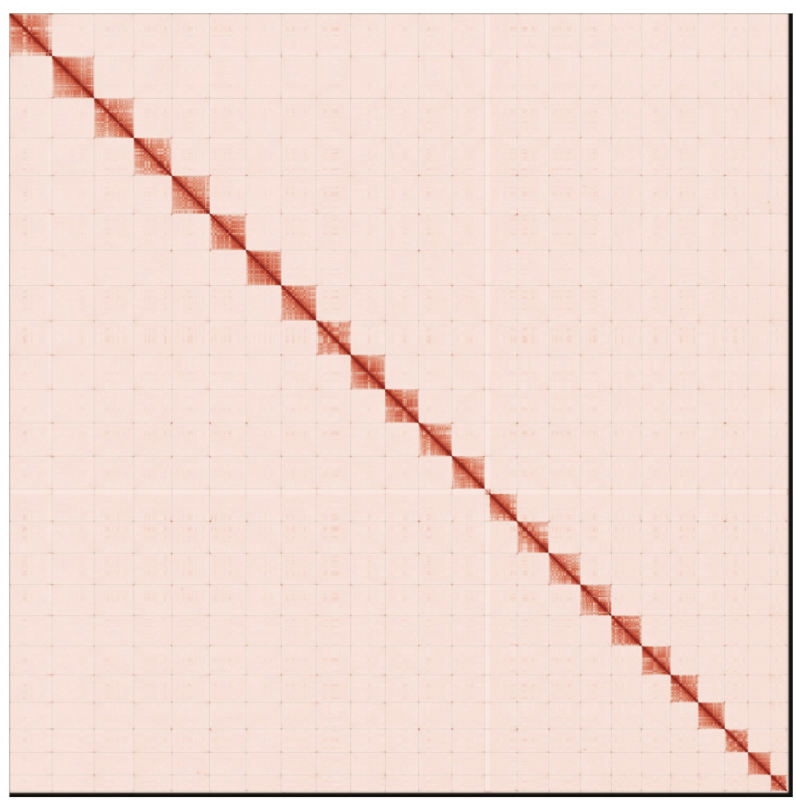
Contact maps for the primary and alternate genome assembly generated with PretextSnapshot. Contact maps translate proximity of genomic regions in 3-D space to contiguous linear organization. Each cell in the contact map corresponds to sequencing data supporting the linkage (or join) between two of such regions. Scaffolds are separated by black lines and higher density corresponds to higher levels of fragmentation.
Authors
Rishi De-Kayne, Stacy Li, Merly Escalona, Runyang Nicolas Lou, Juan Manuel Vazquez, Gregory L Owens, Sree Rohit Raj Kolora, Conner Jainese, Katelin Seeto, Merit McCrea, Oanh Nguyen, Noravit Chumchim, Ruta Sahasrabudhe, Colin W Fairbairn, Richard E Green, William E Seligmann, Milton Love, Peter H Sudmant