Puma concolor (Mountain Lion)
Visual overview of genome assembly metrics
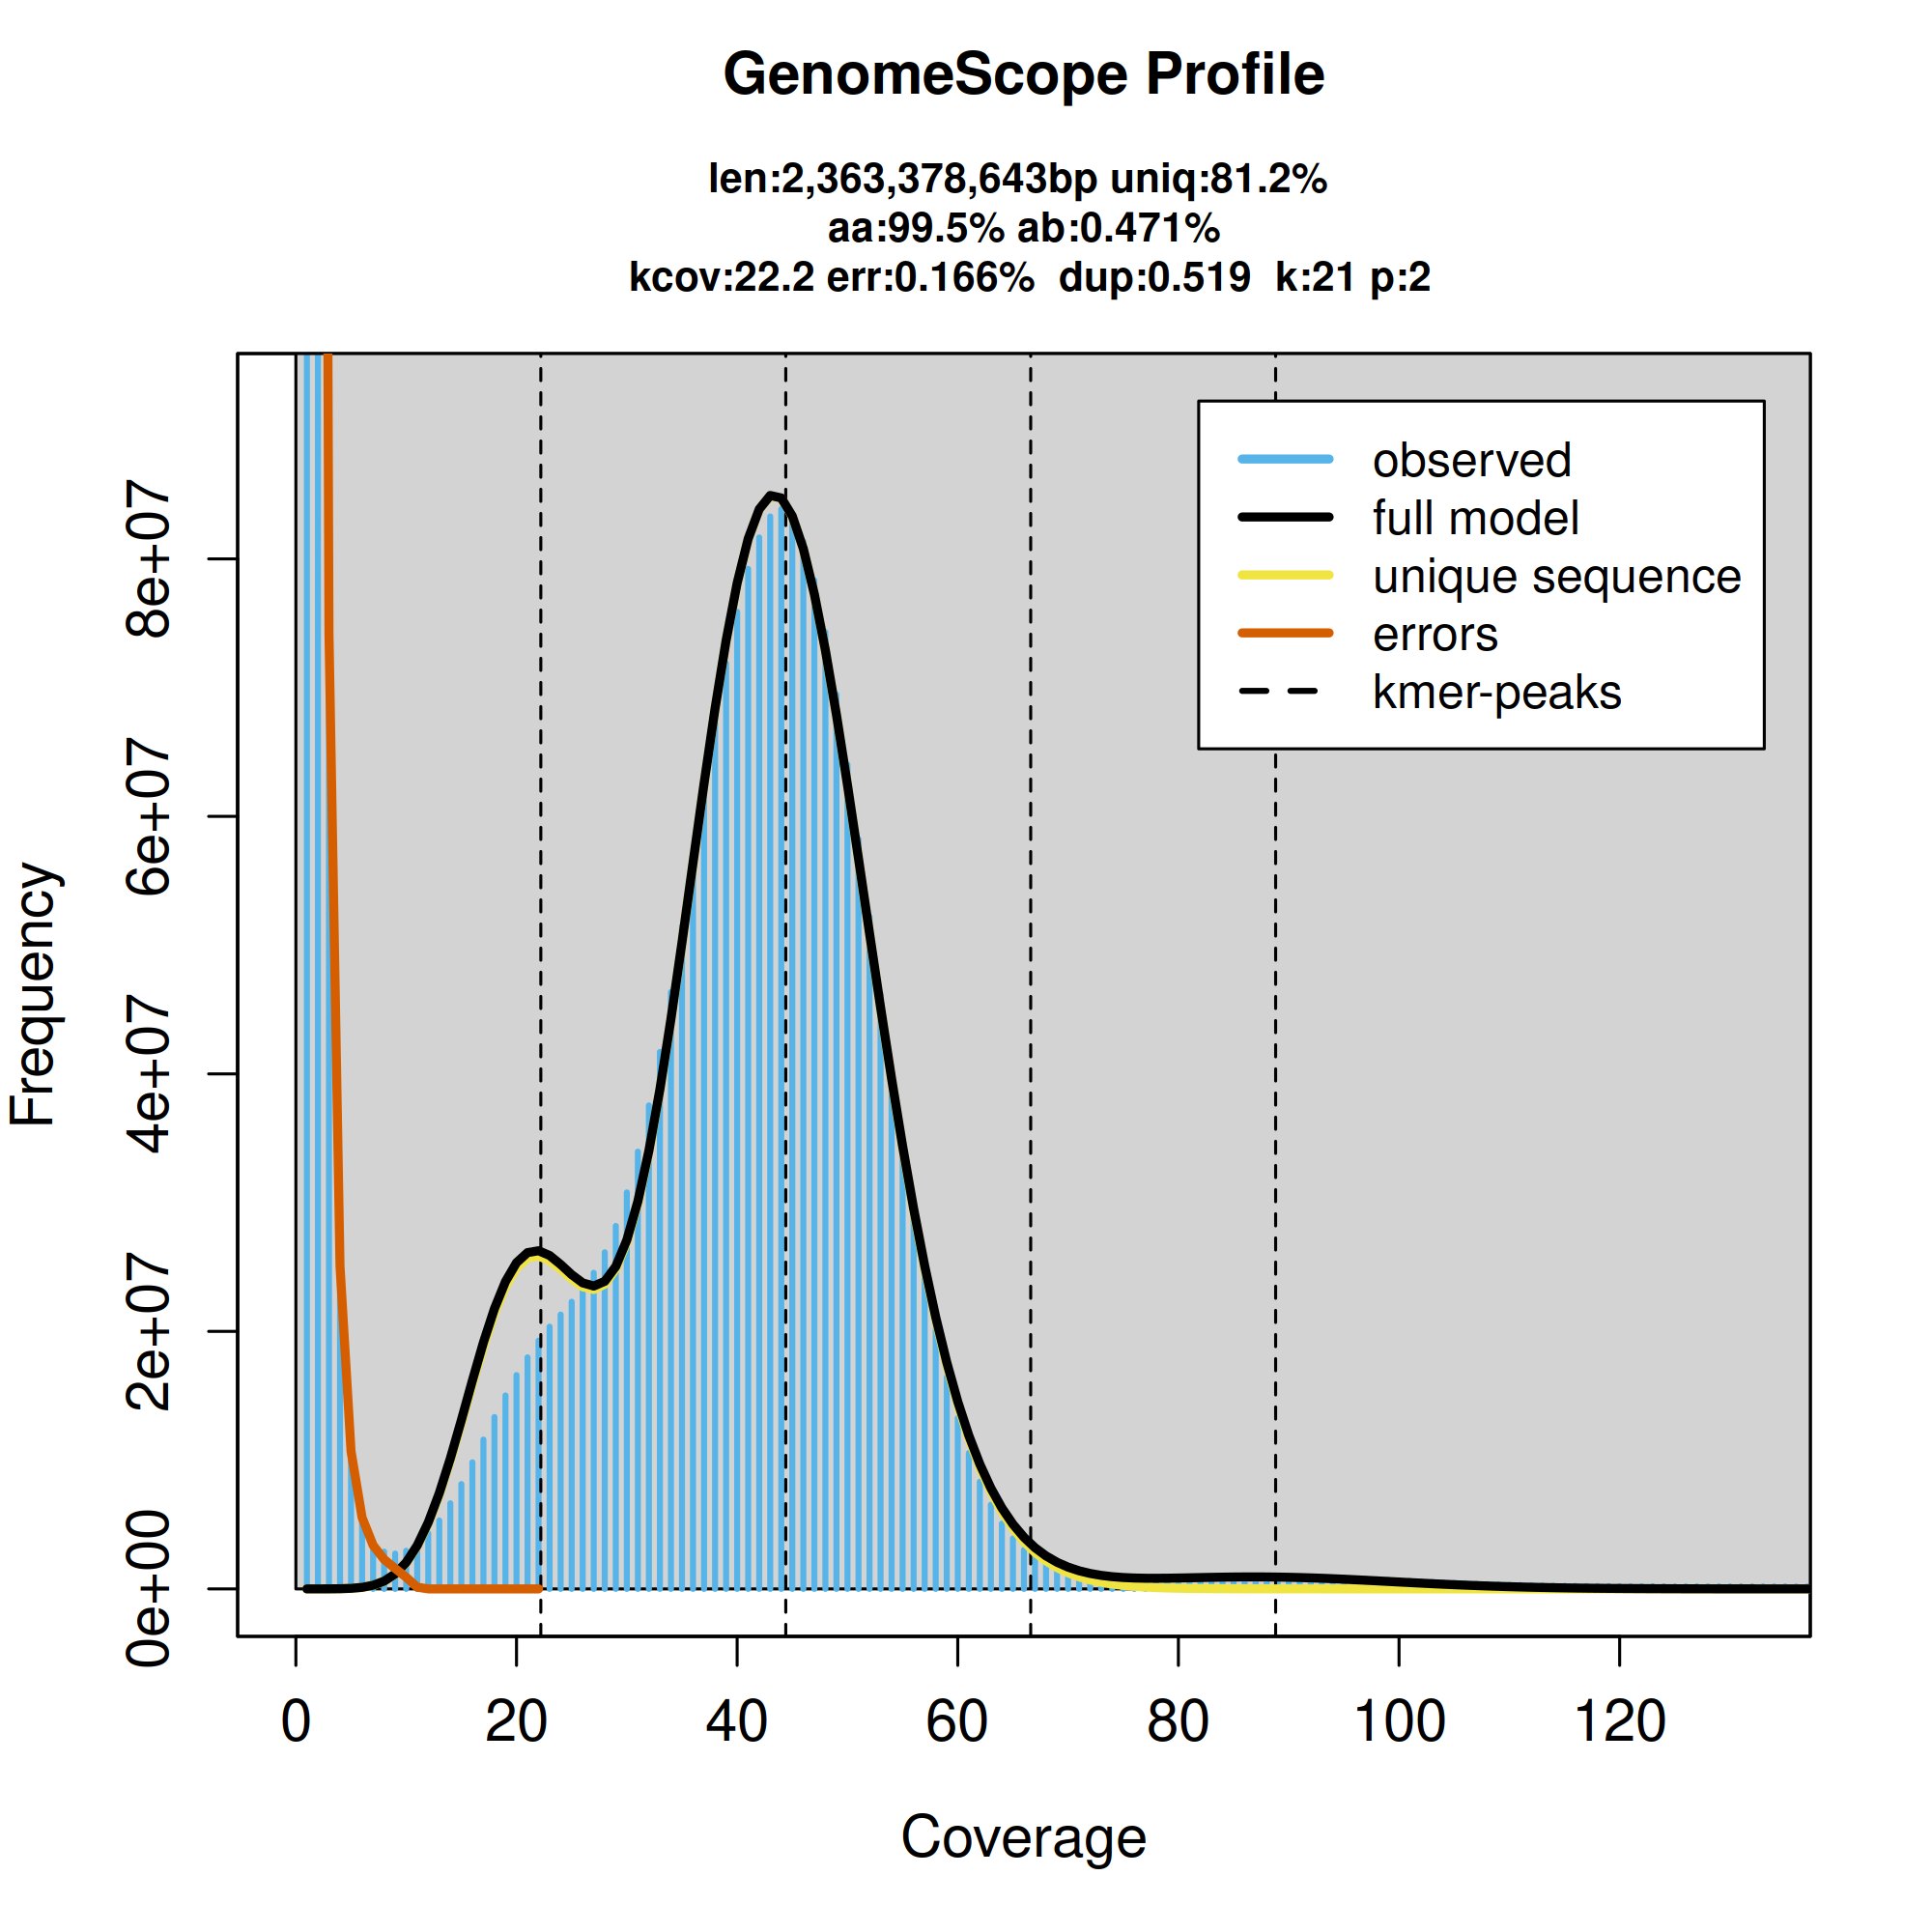
K-mer frequencies from the adapter-trimmed PacBio HiFi data used to estimate genome size, sequencing error rate, and heterozygosity. The main peak at ~44-fold coverage corresponds to homozygous regions of the genome, whereas the peak at ~22-fold corresponds to heterozygous regions of the genome. The peak near zero corresponds to probable sequencing errors.
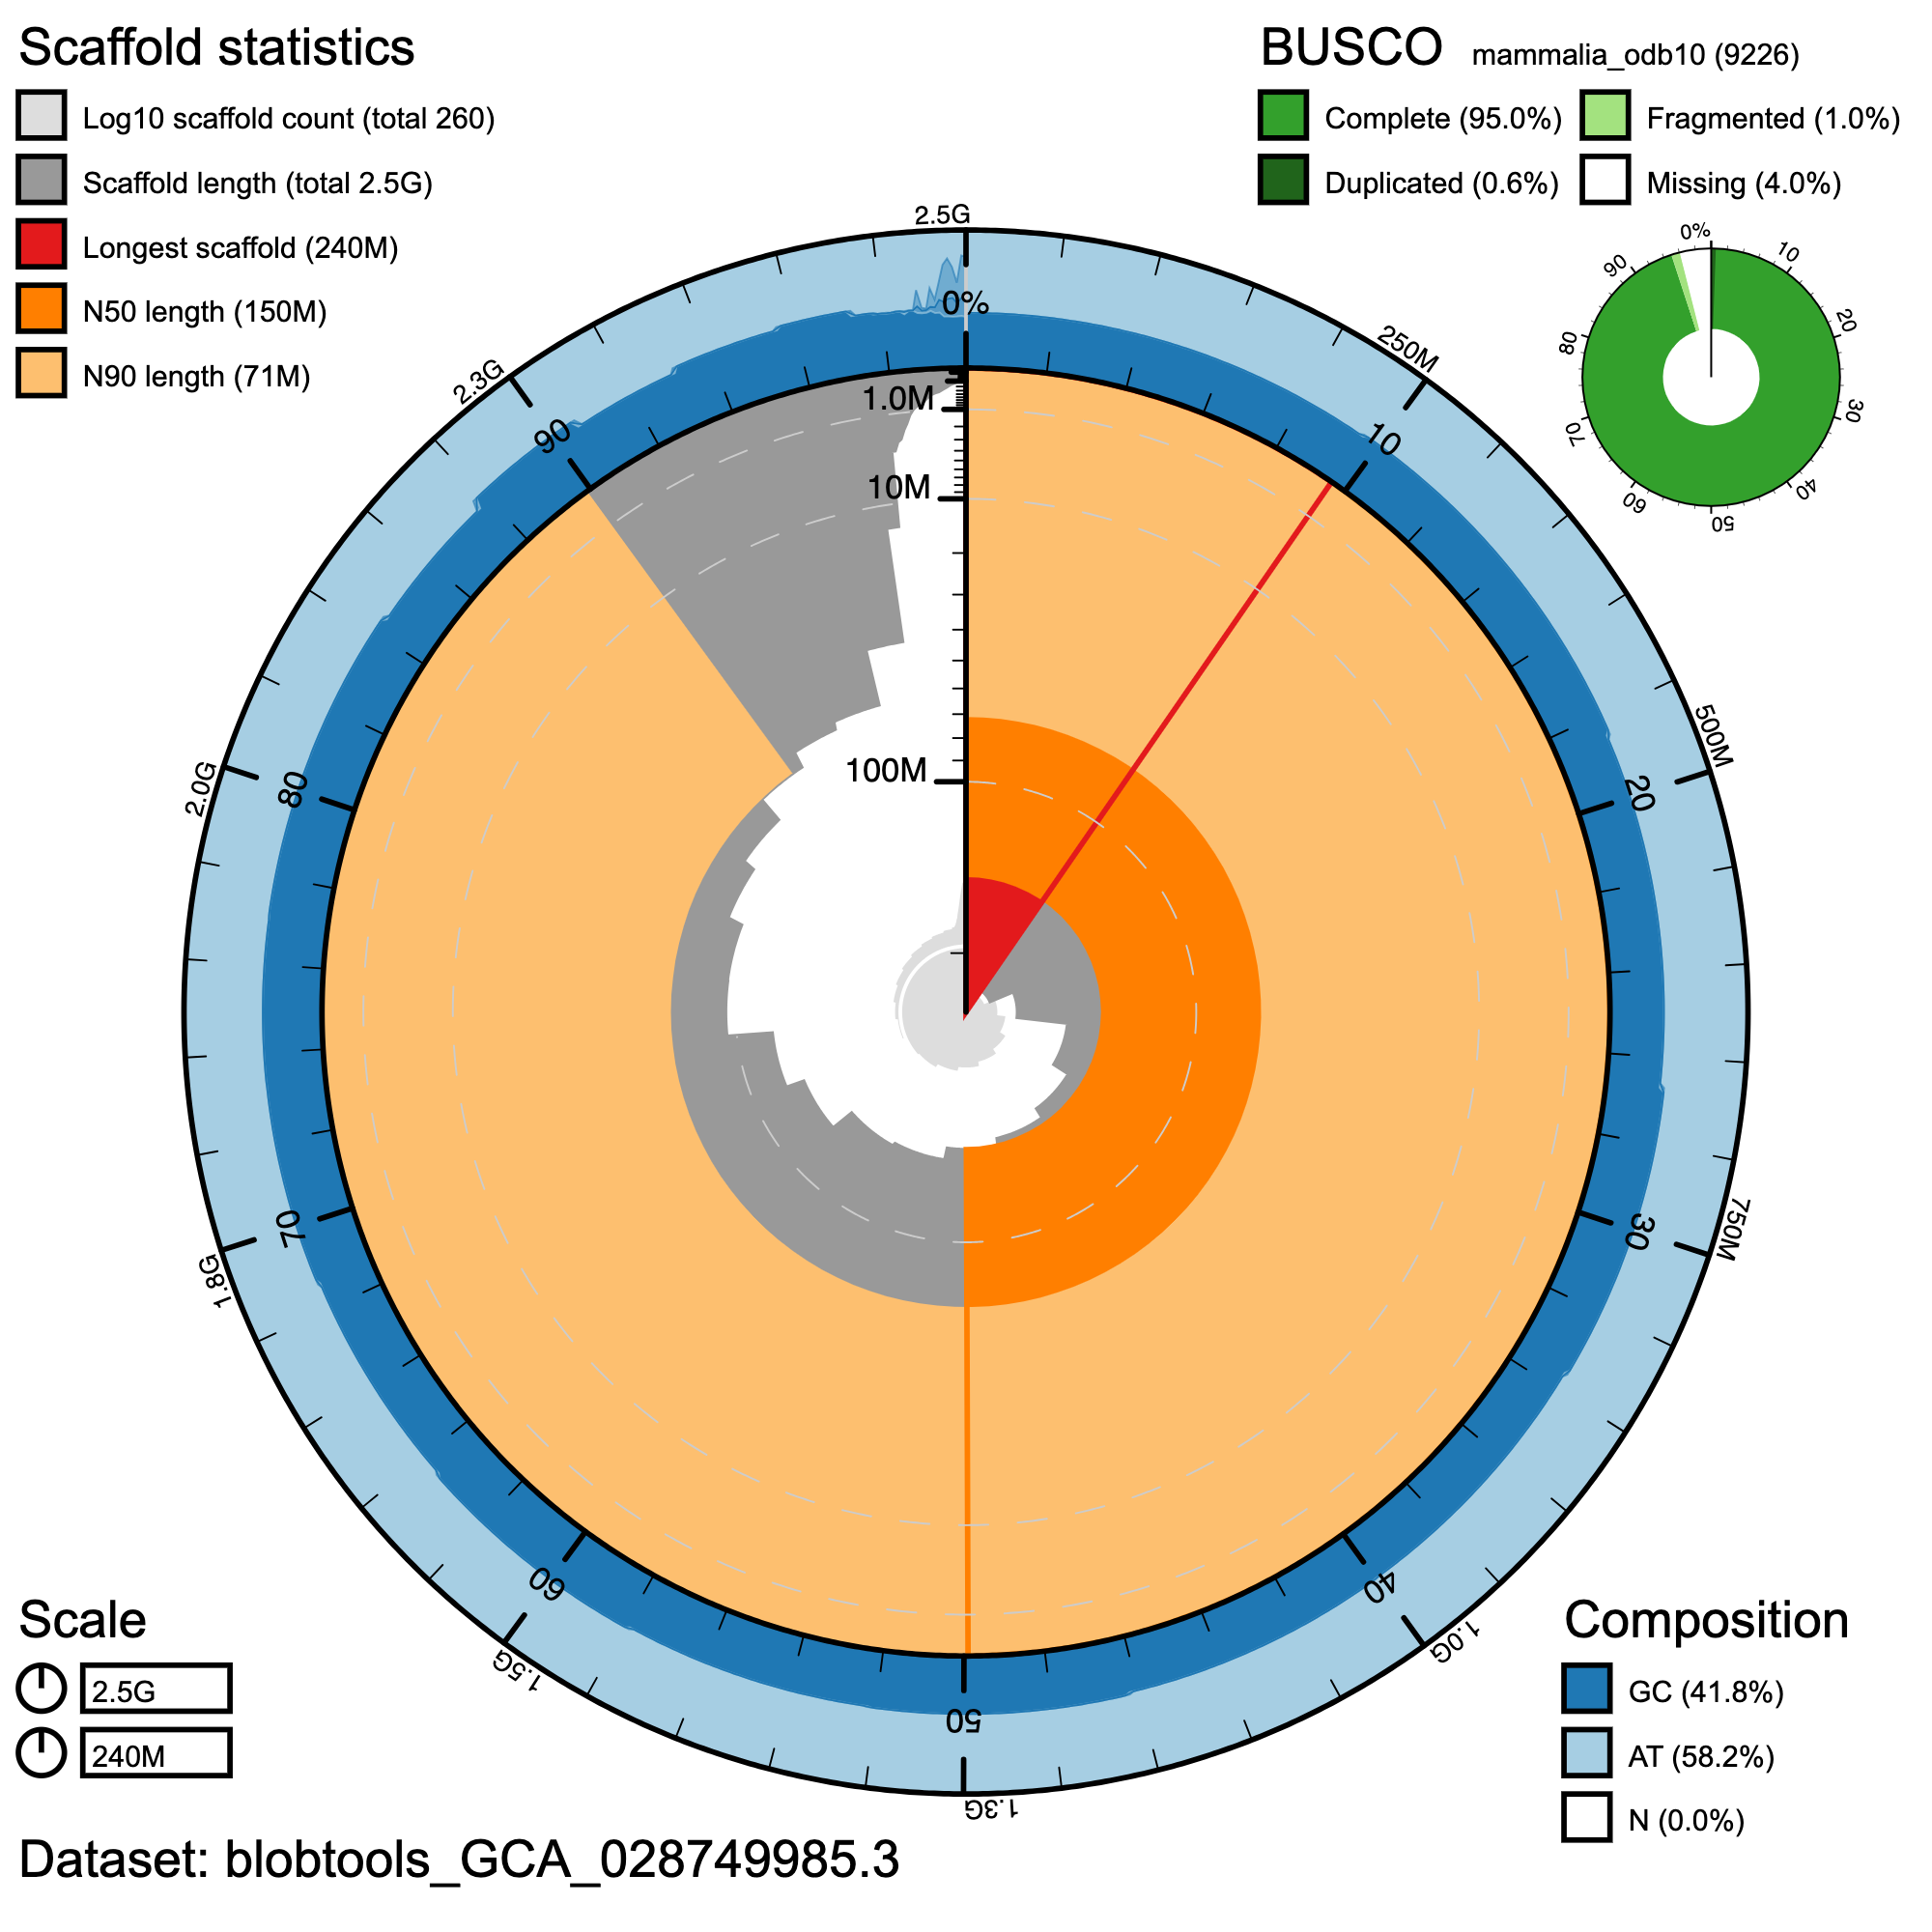
BlobToolKit Snail plot showing a graphical representation of the quality metrics for the primary assembly. The plot circle represents the full size of the assembly. From the inside-out, the central plot covers length-related metrics. The red line represents the size of the longest scaffold; all other scaffolds are arranged in size-order moving clockwise around the plot and drawn in grey starting from the outside of the central plot. Dark and light orange arcs show the scaffold N50 and scaffold N90 values. The central light grey spiral shows the cumulative scaffold count with a white line at each order of magnitude. White regions in this area reflect the proportion of Ns in the assembly The dark vs. light blue area around it shows mean, maximum and minimum GC vs. AT content at 0.1% intervals (Challis et al. 2020)
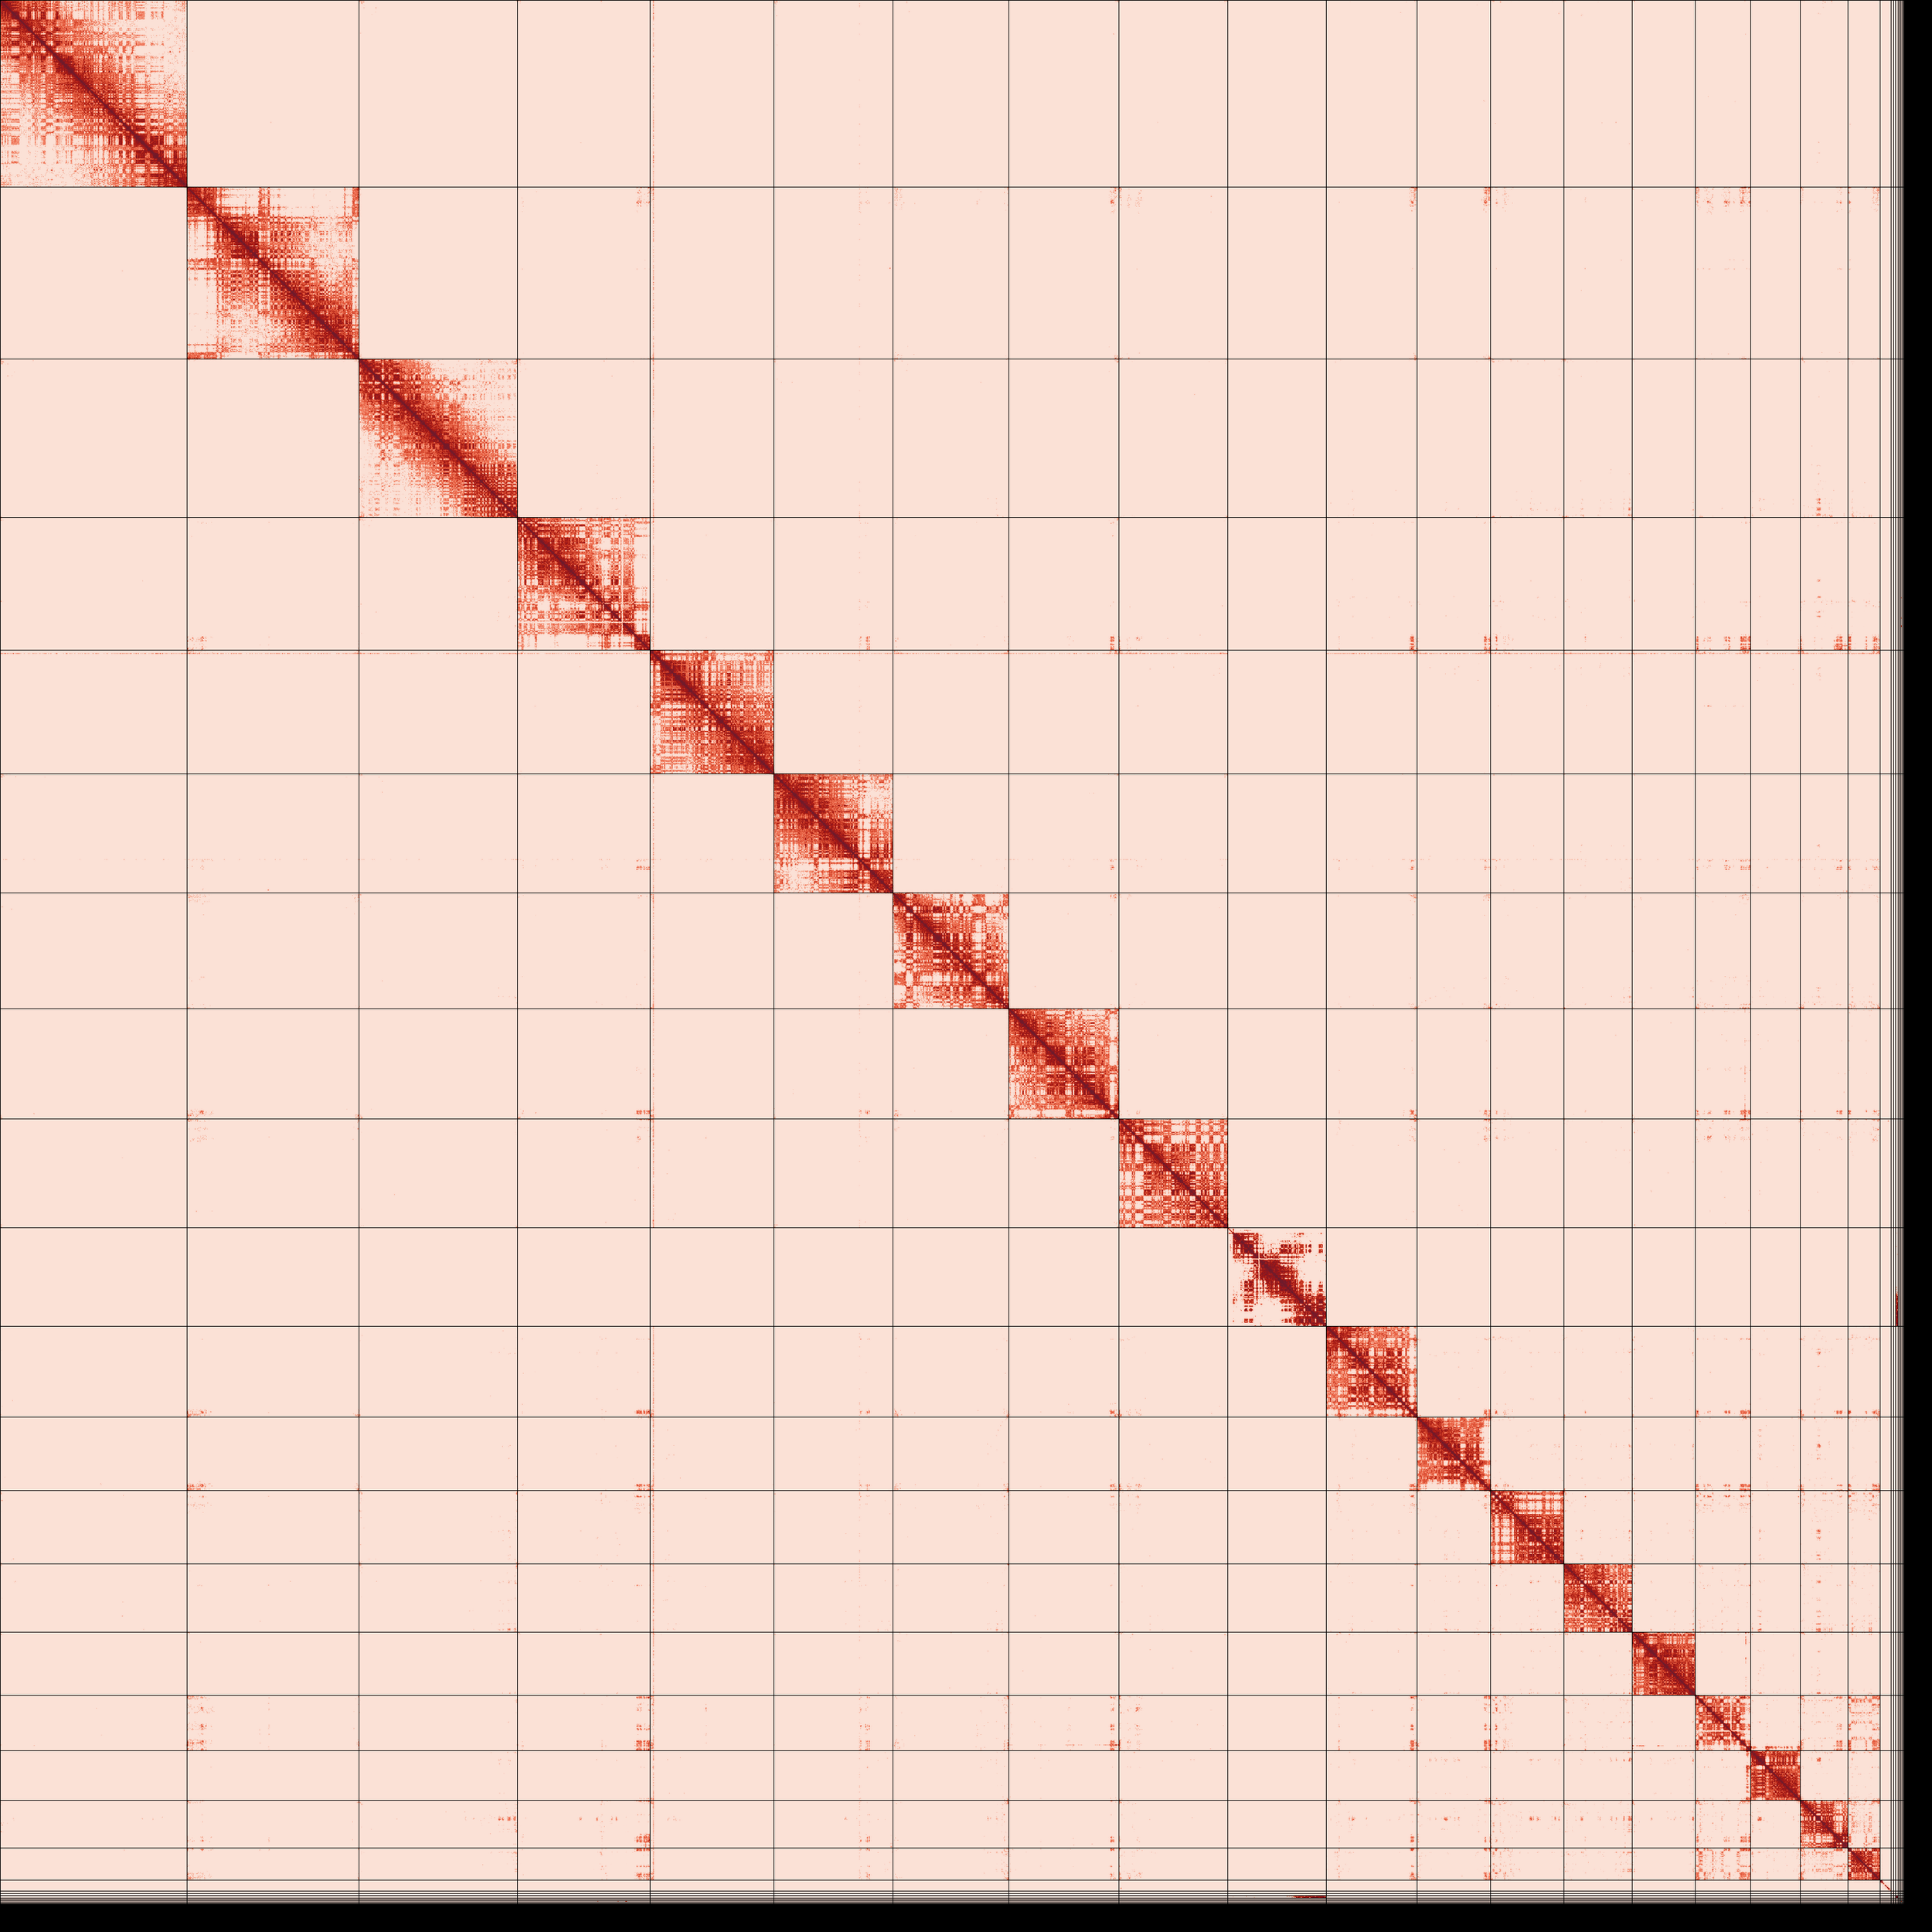
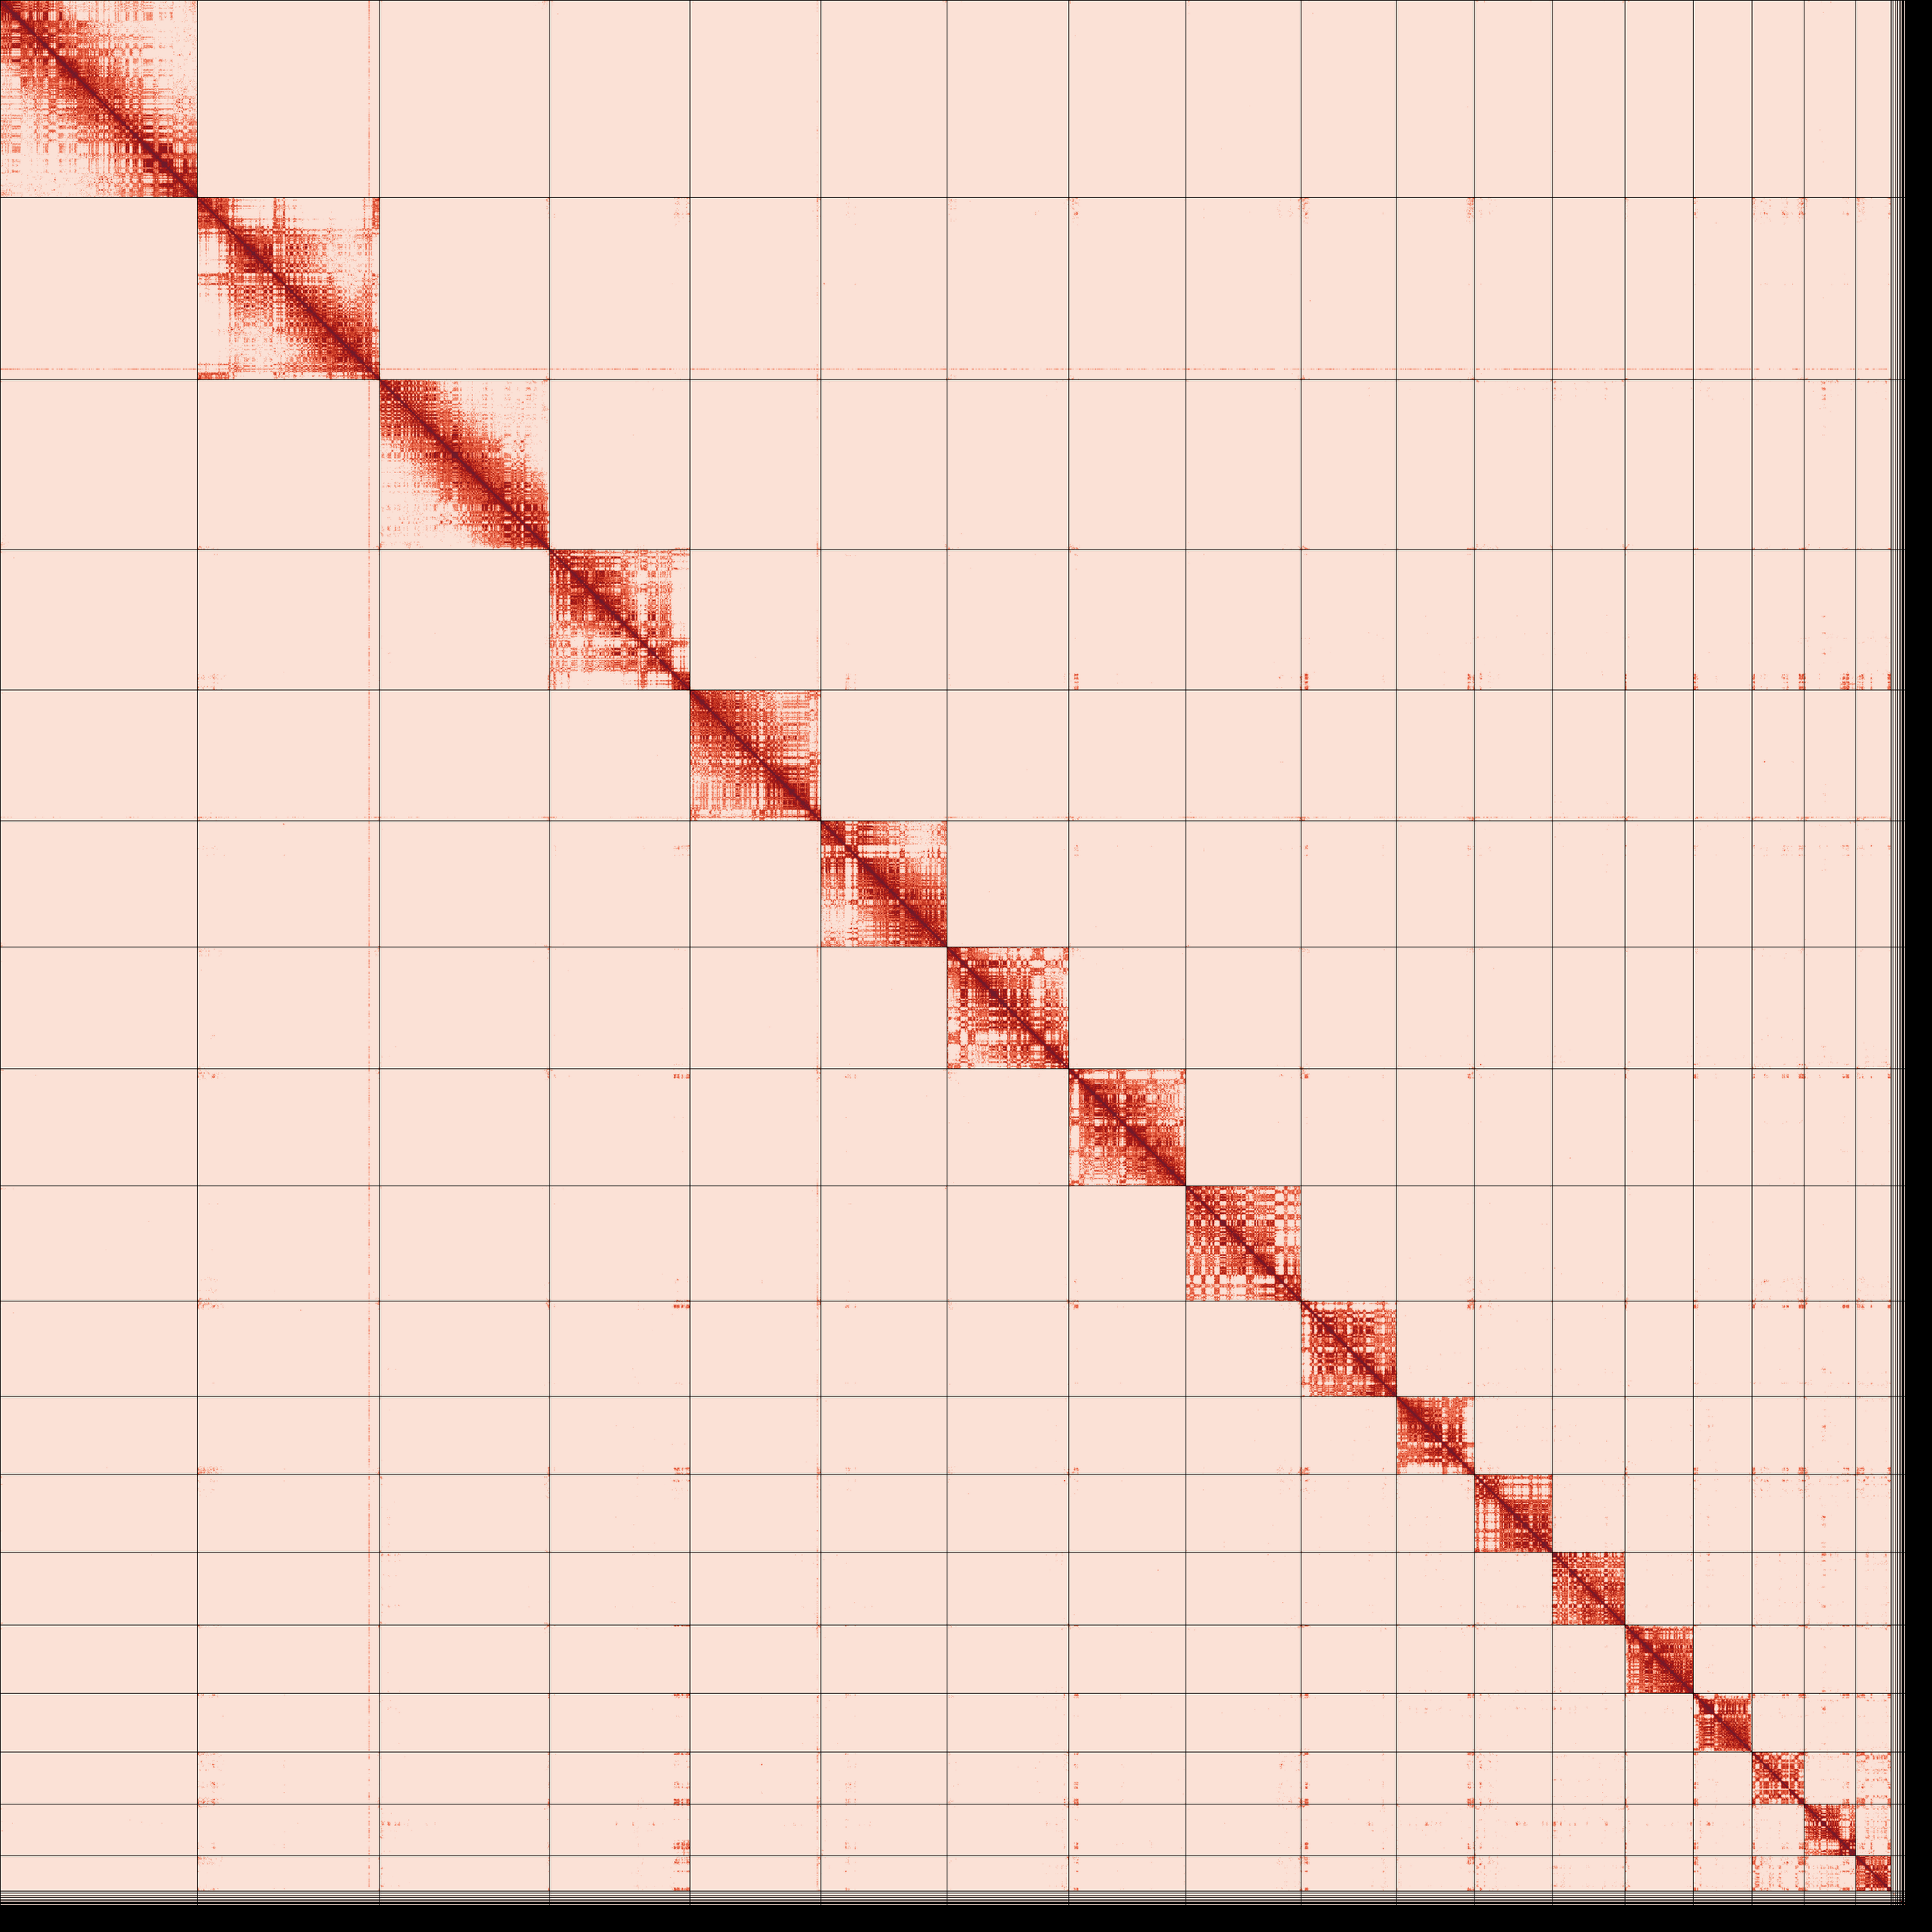
Omni-C contact map for the primary and alternate assemblies after manual curation shows the 3D organization of the genome, with darker areas indicating closer proximity.
Authors
Megan A Supple, Merly Escalona, Nicolas Alexandre, Michael R Buchalski, Seth P D Riley, Justin A Dellinger, T Winston Vickers, Ruta Sahasrabudhe, Oanh Nguyen, Colin W Fairbairn, William E Seligmann, Christopher C Wilmers, Beth Shapiro