Dipodomys merriami (Merriam’s Kangaroo Rat)
Visual overview of genome assembly metrics
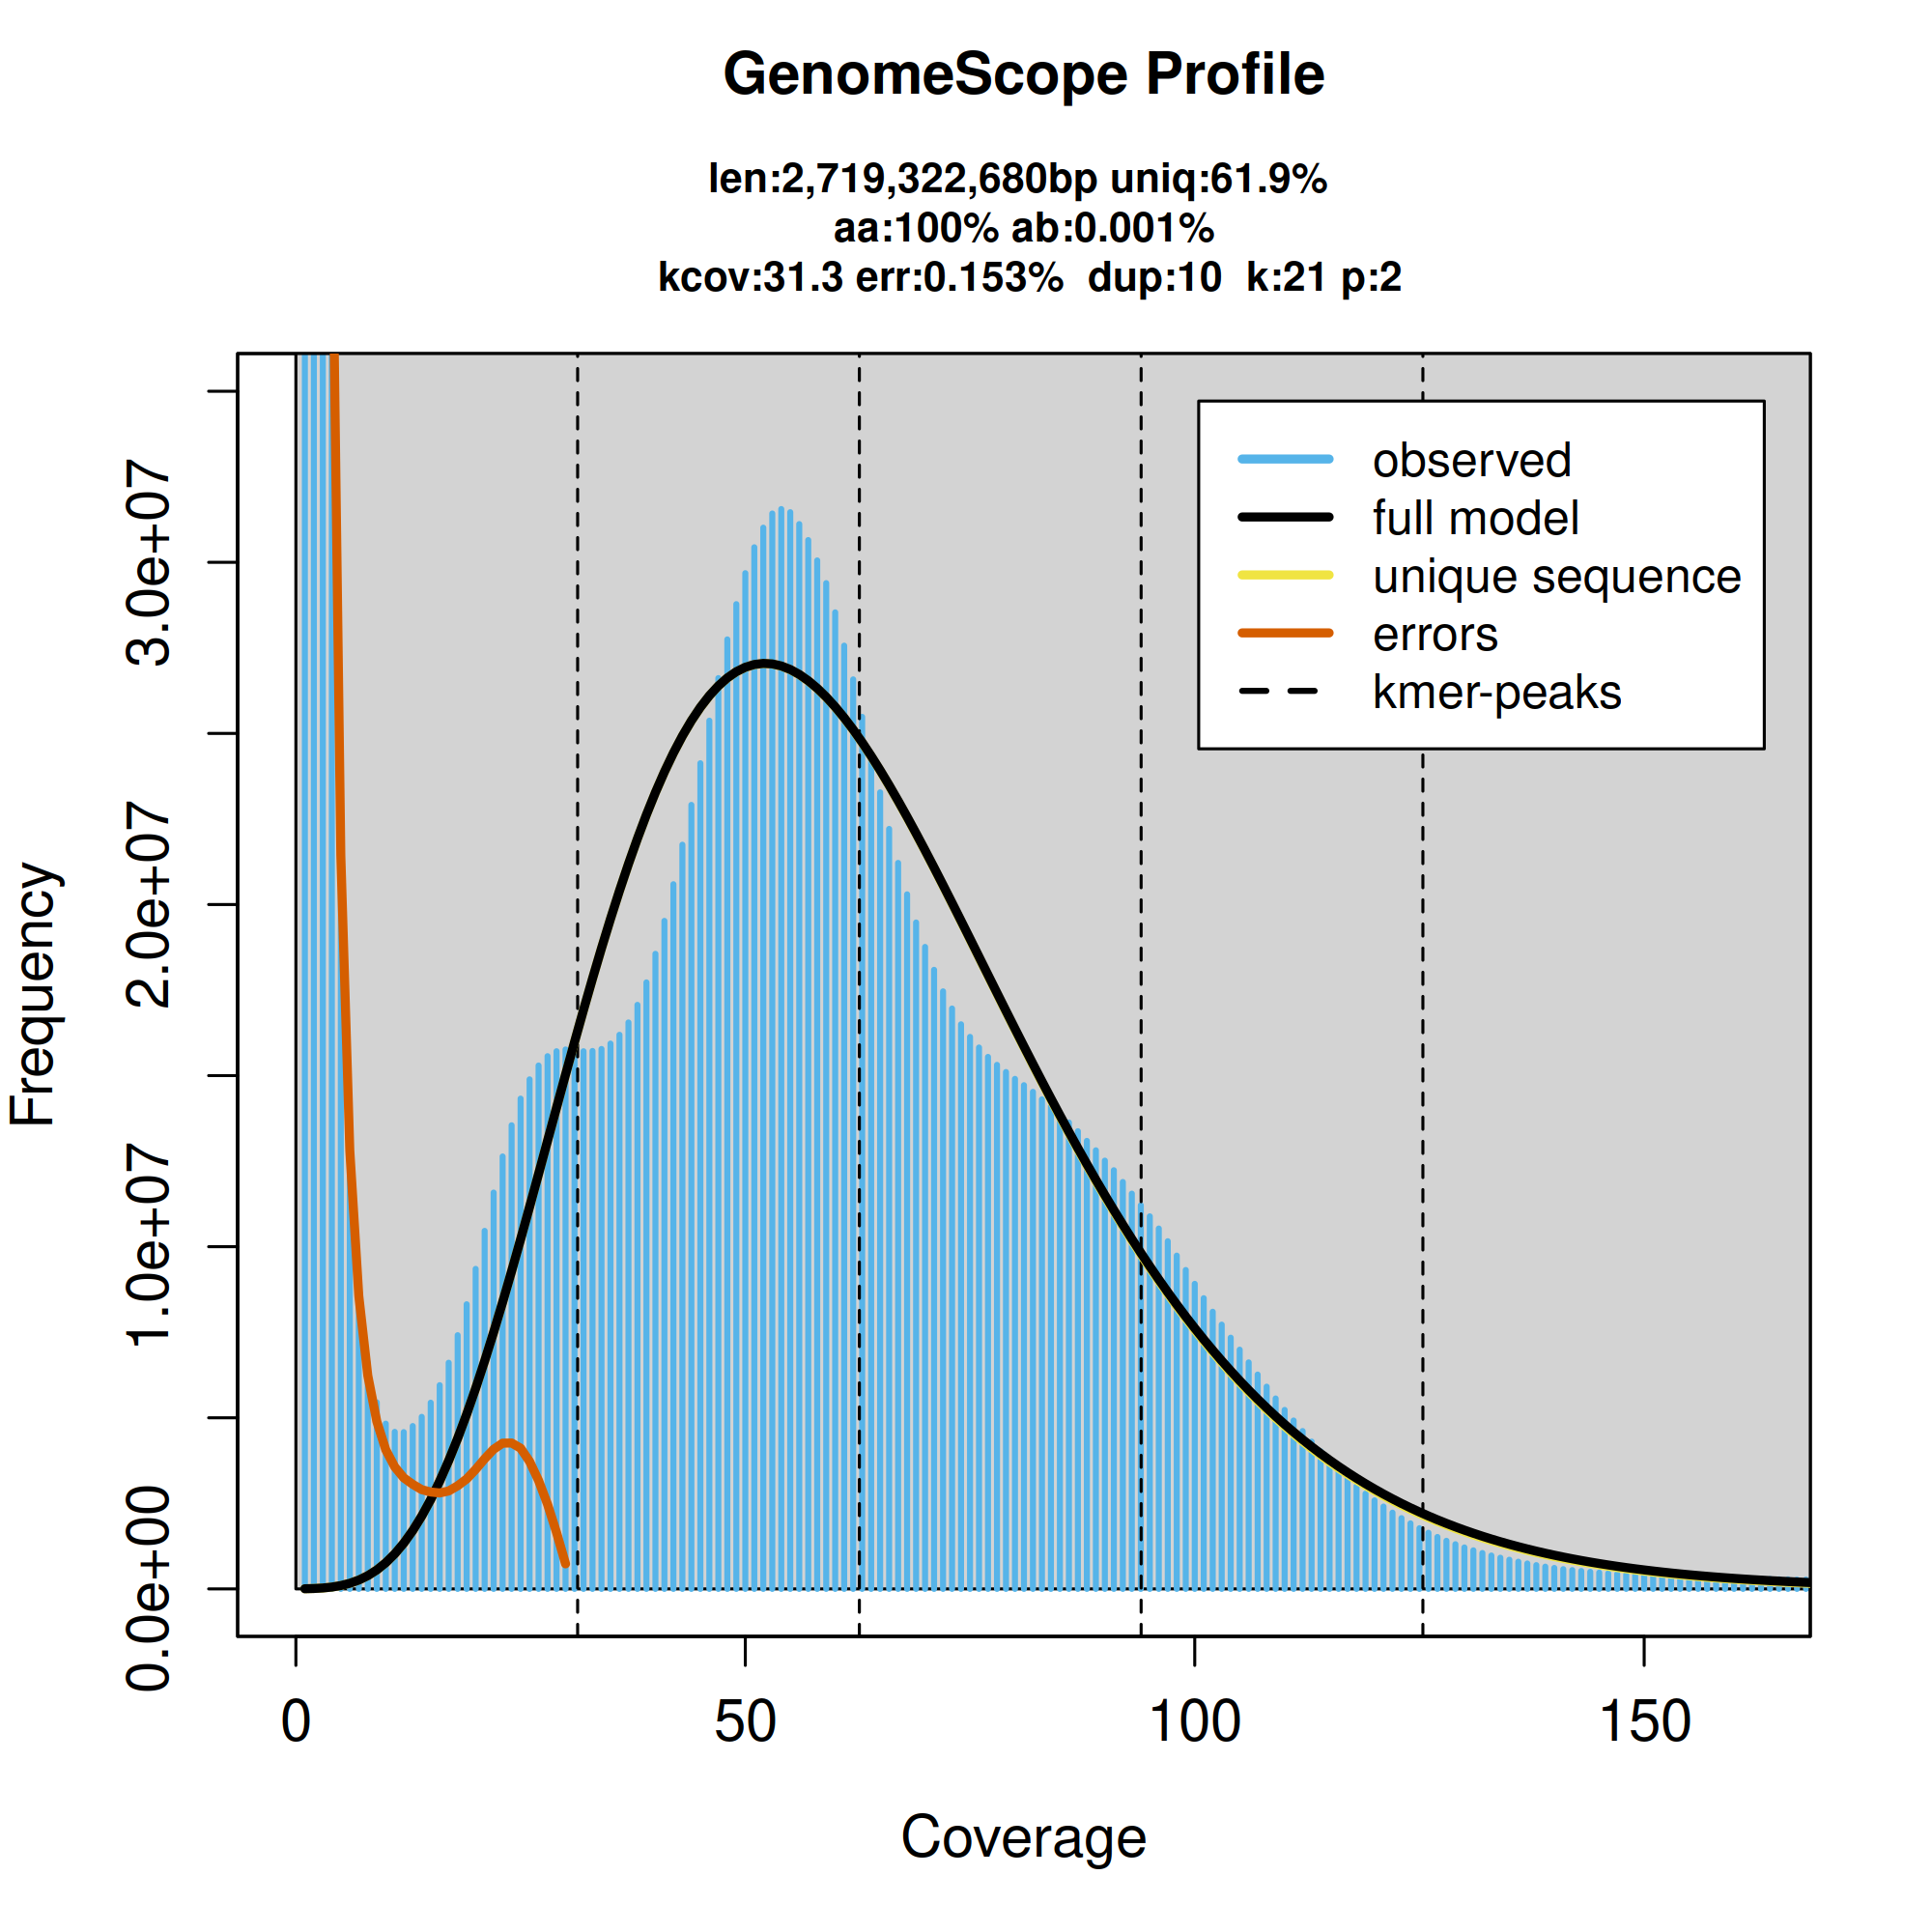
GenomeScope2.0 k-mer spectrum from adapter-trimmed HiFi sequence data.
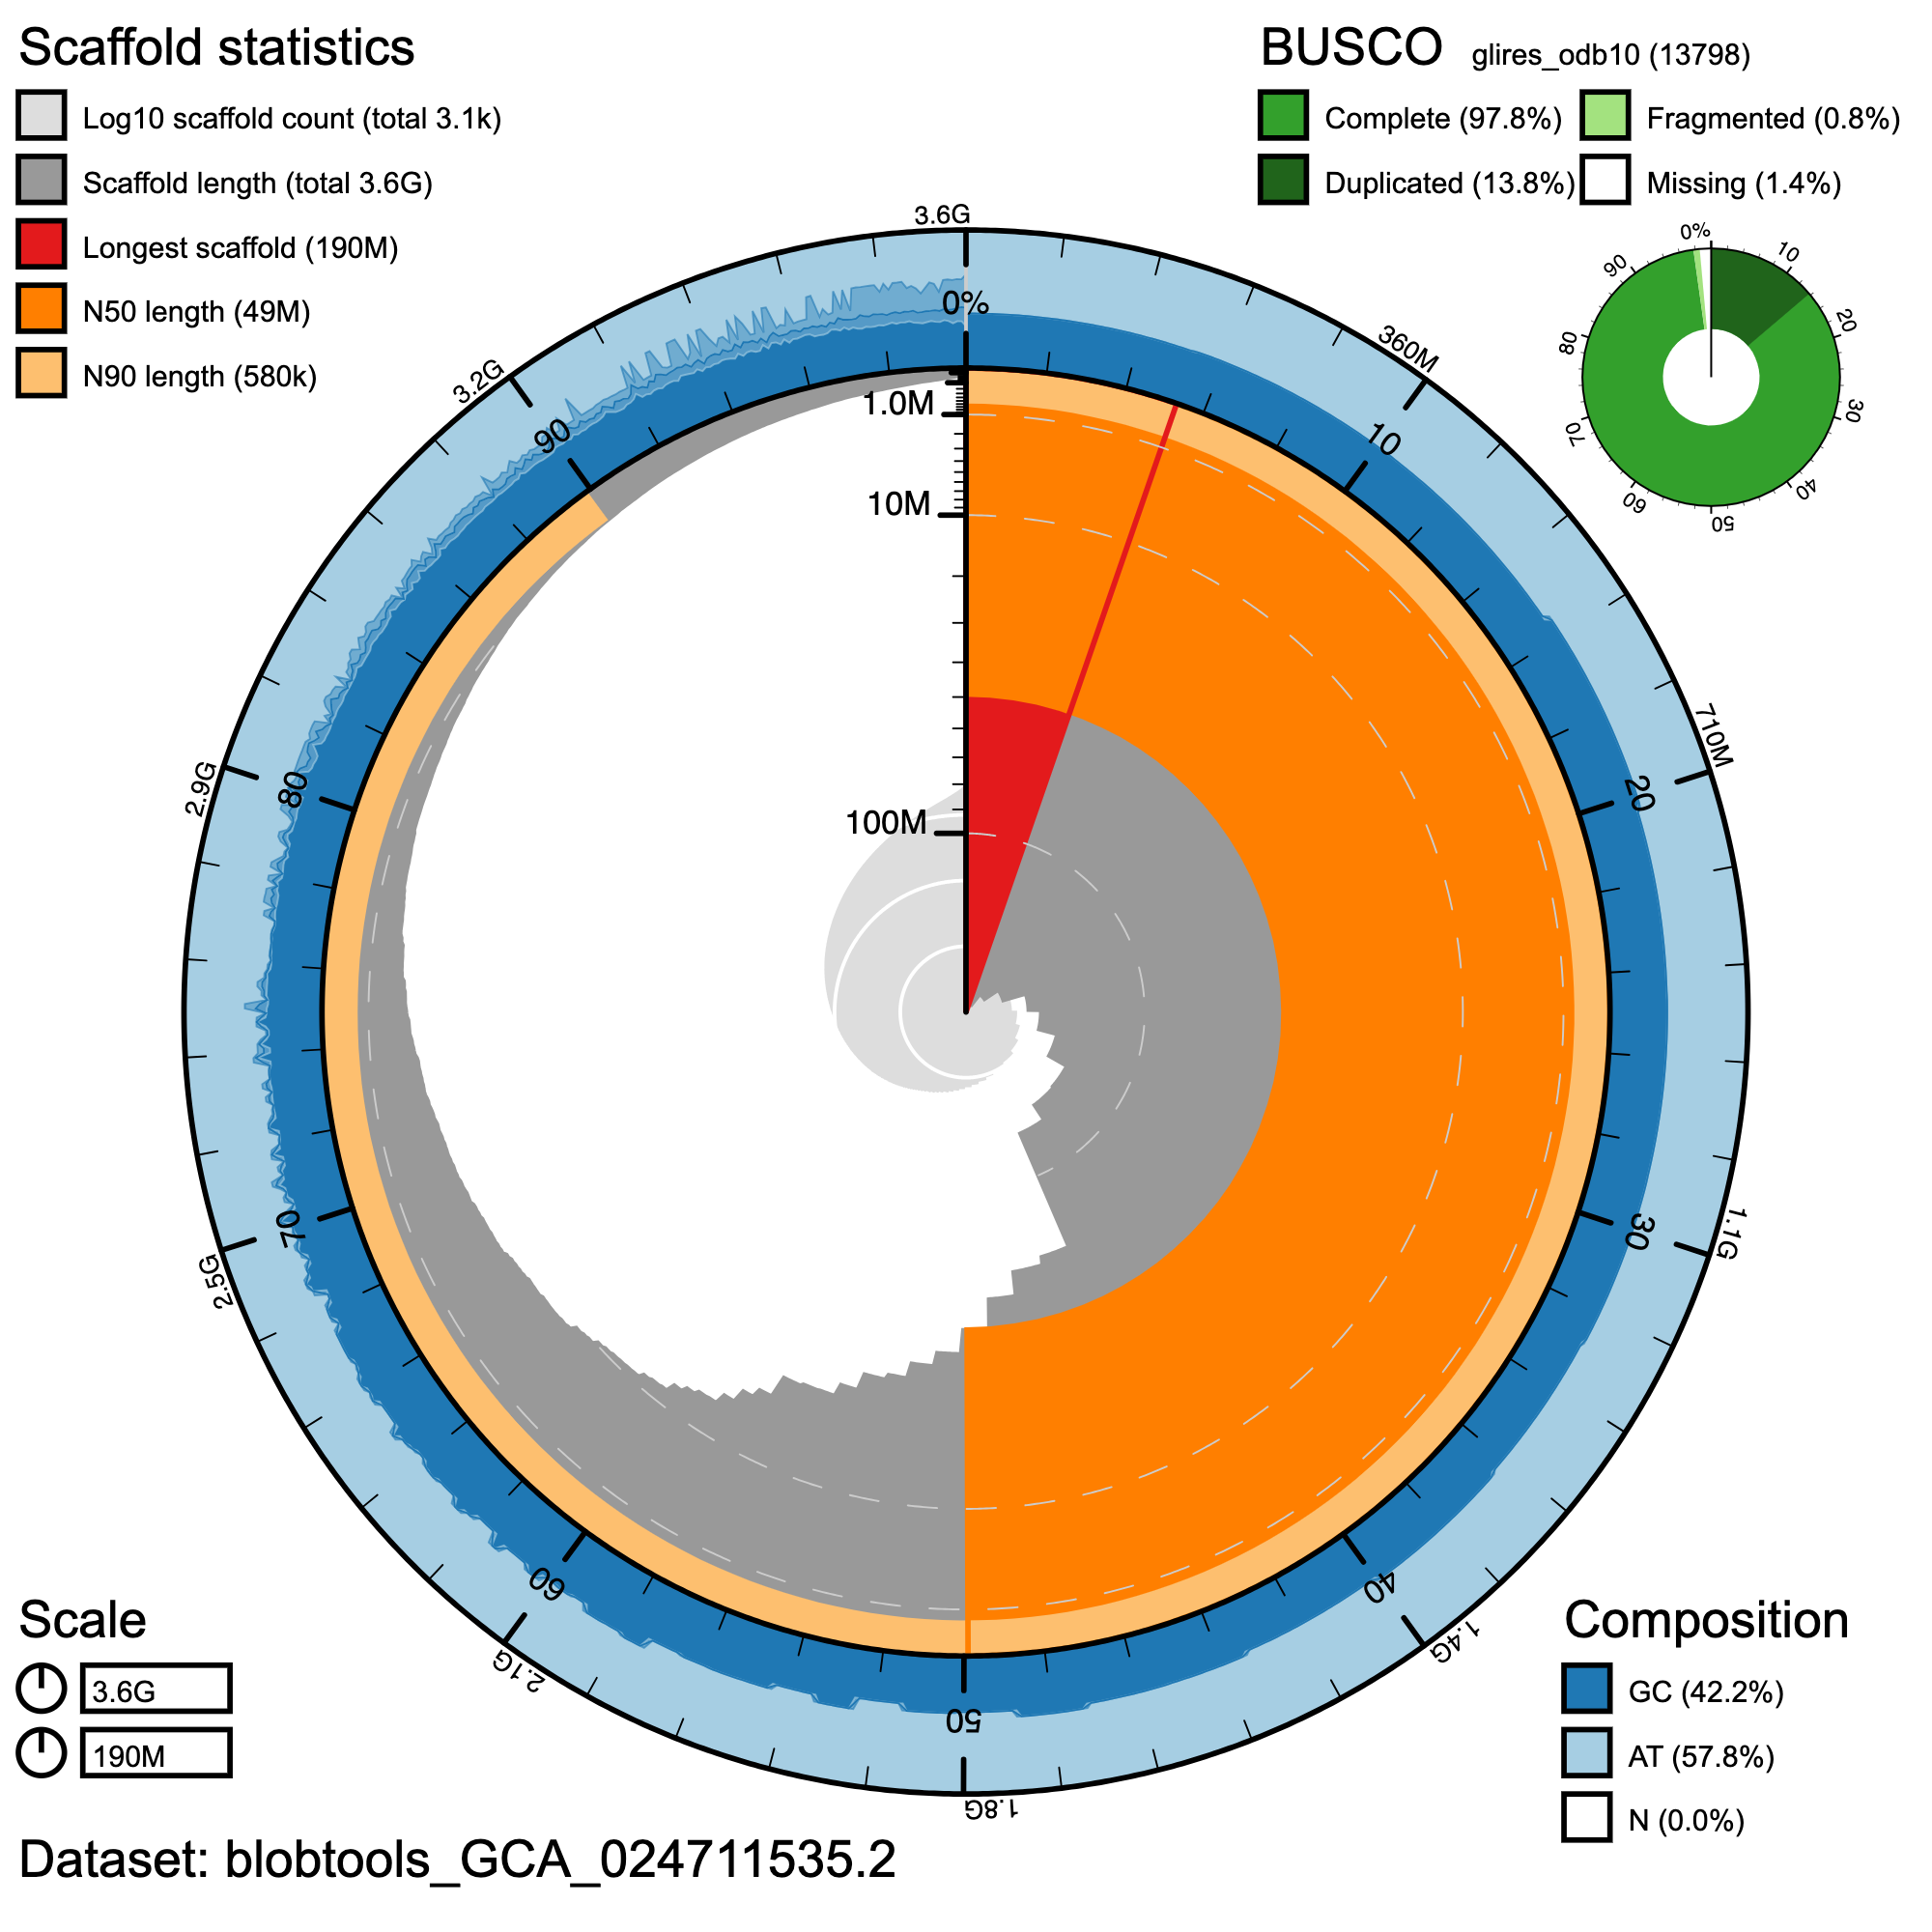
Snail plot summary visual of D. merriami primary assembly quality generated with BlobToolKit (Challis et al. 2020). Central circular plot represents the entire length of the genome, with scaffolds added in clockwise fashion from longest to shortest. The outer ring indicates relative AT/CG content, and scaffold summary statistics and BUSCO scores are shown at top left and right.
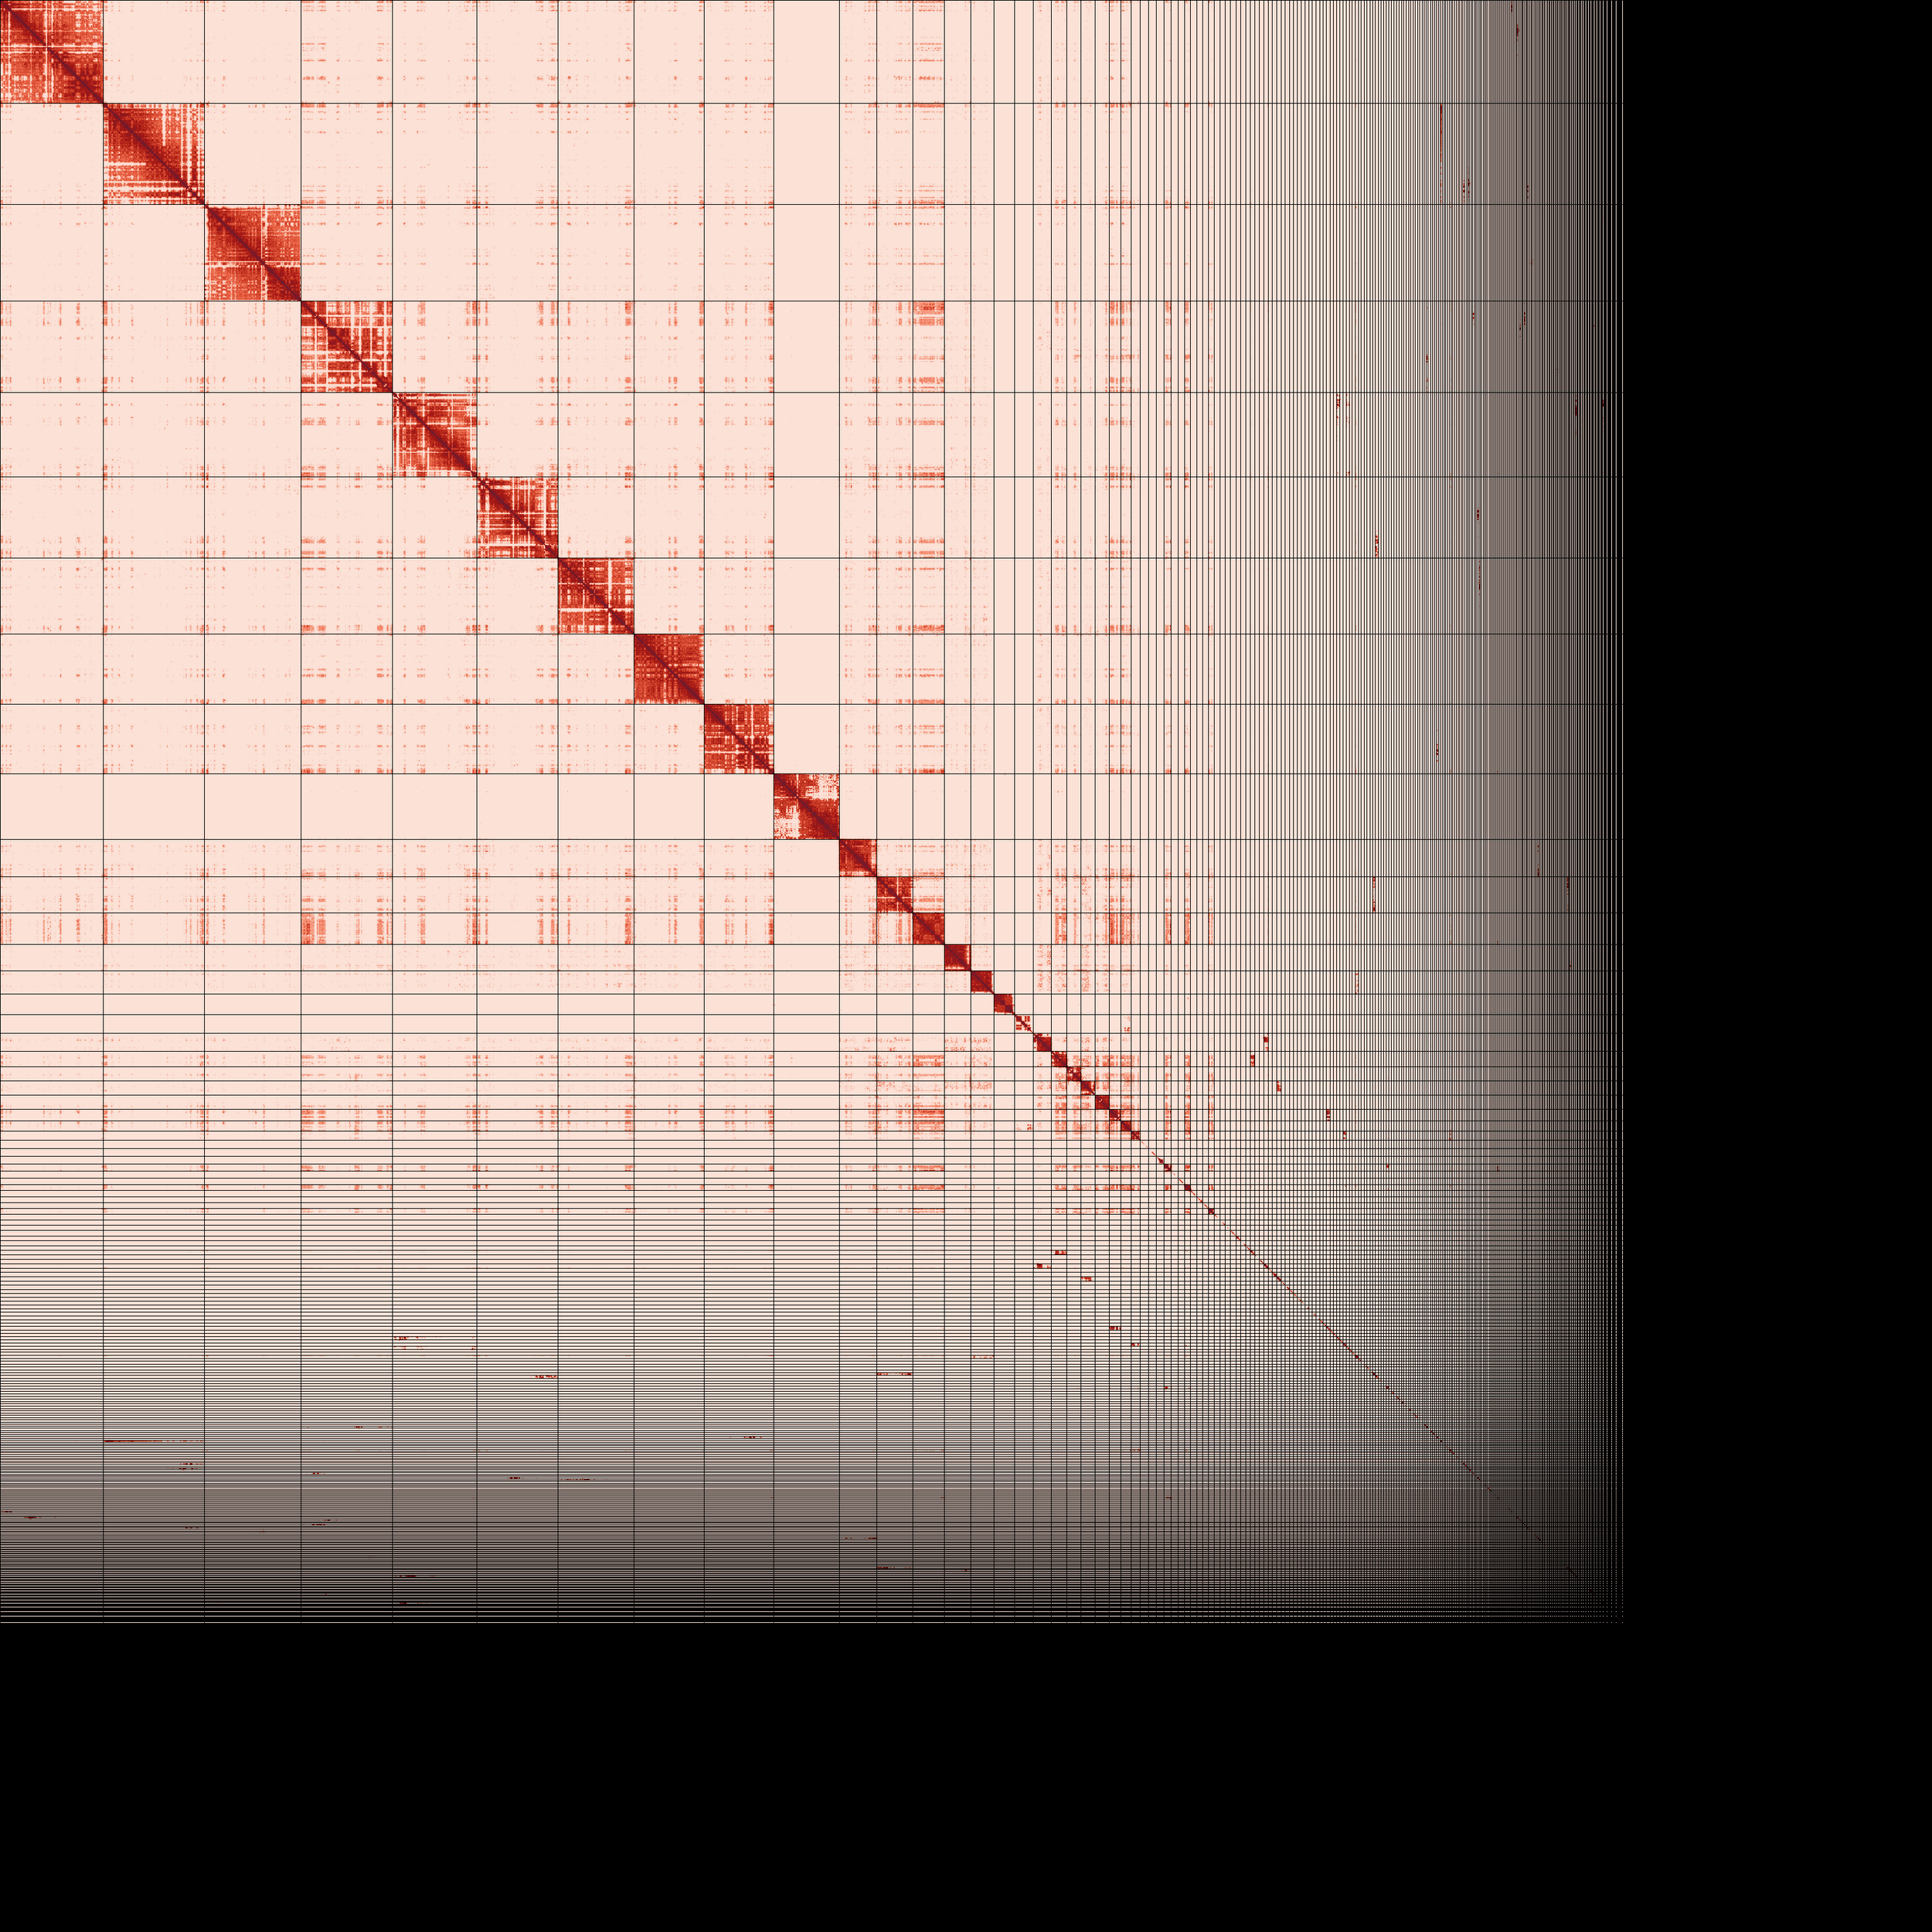
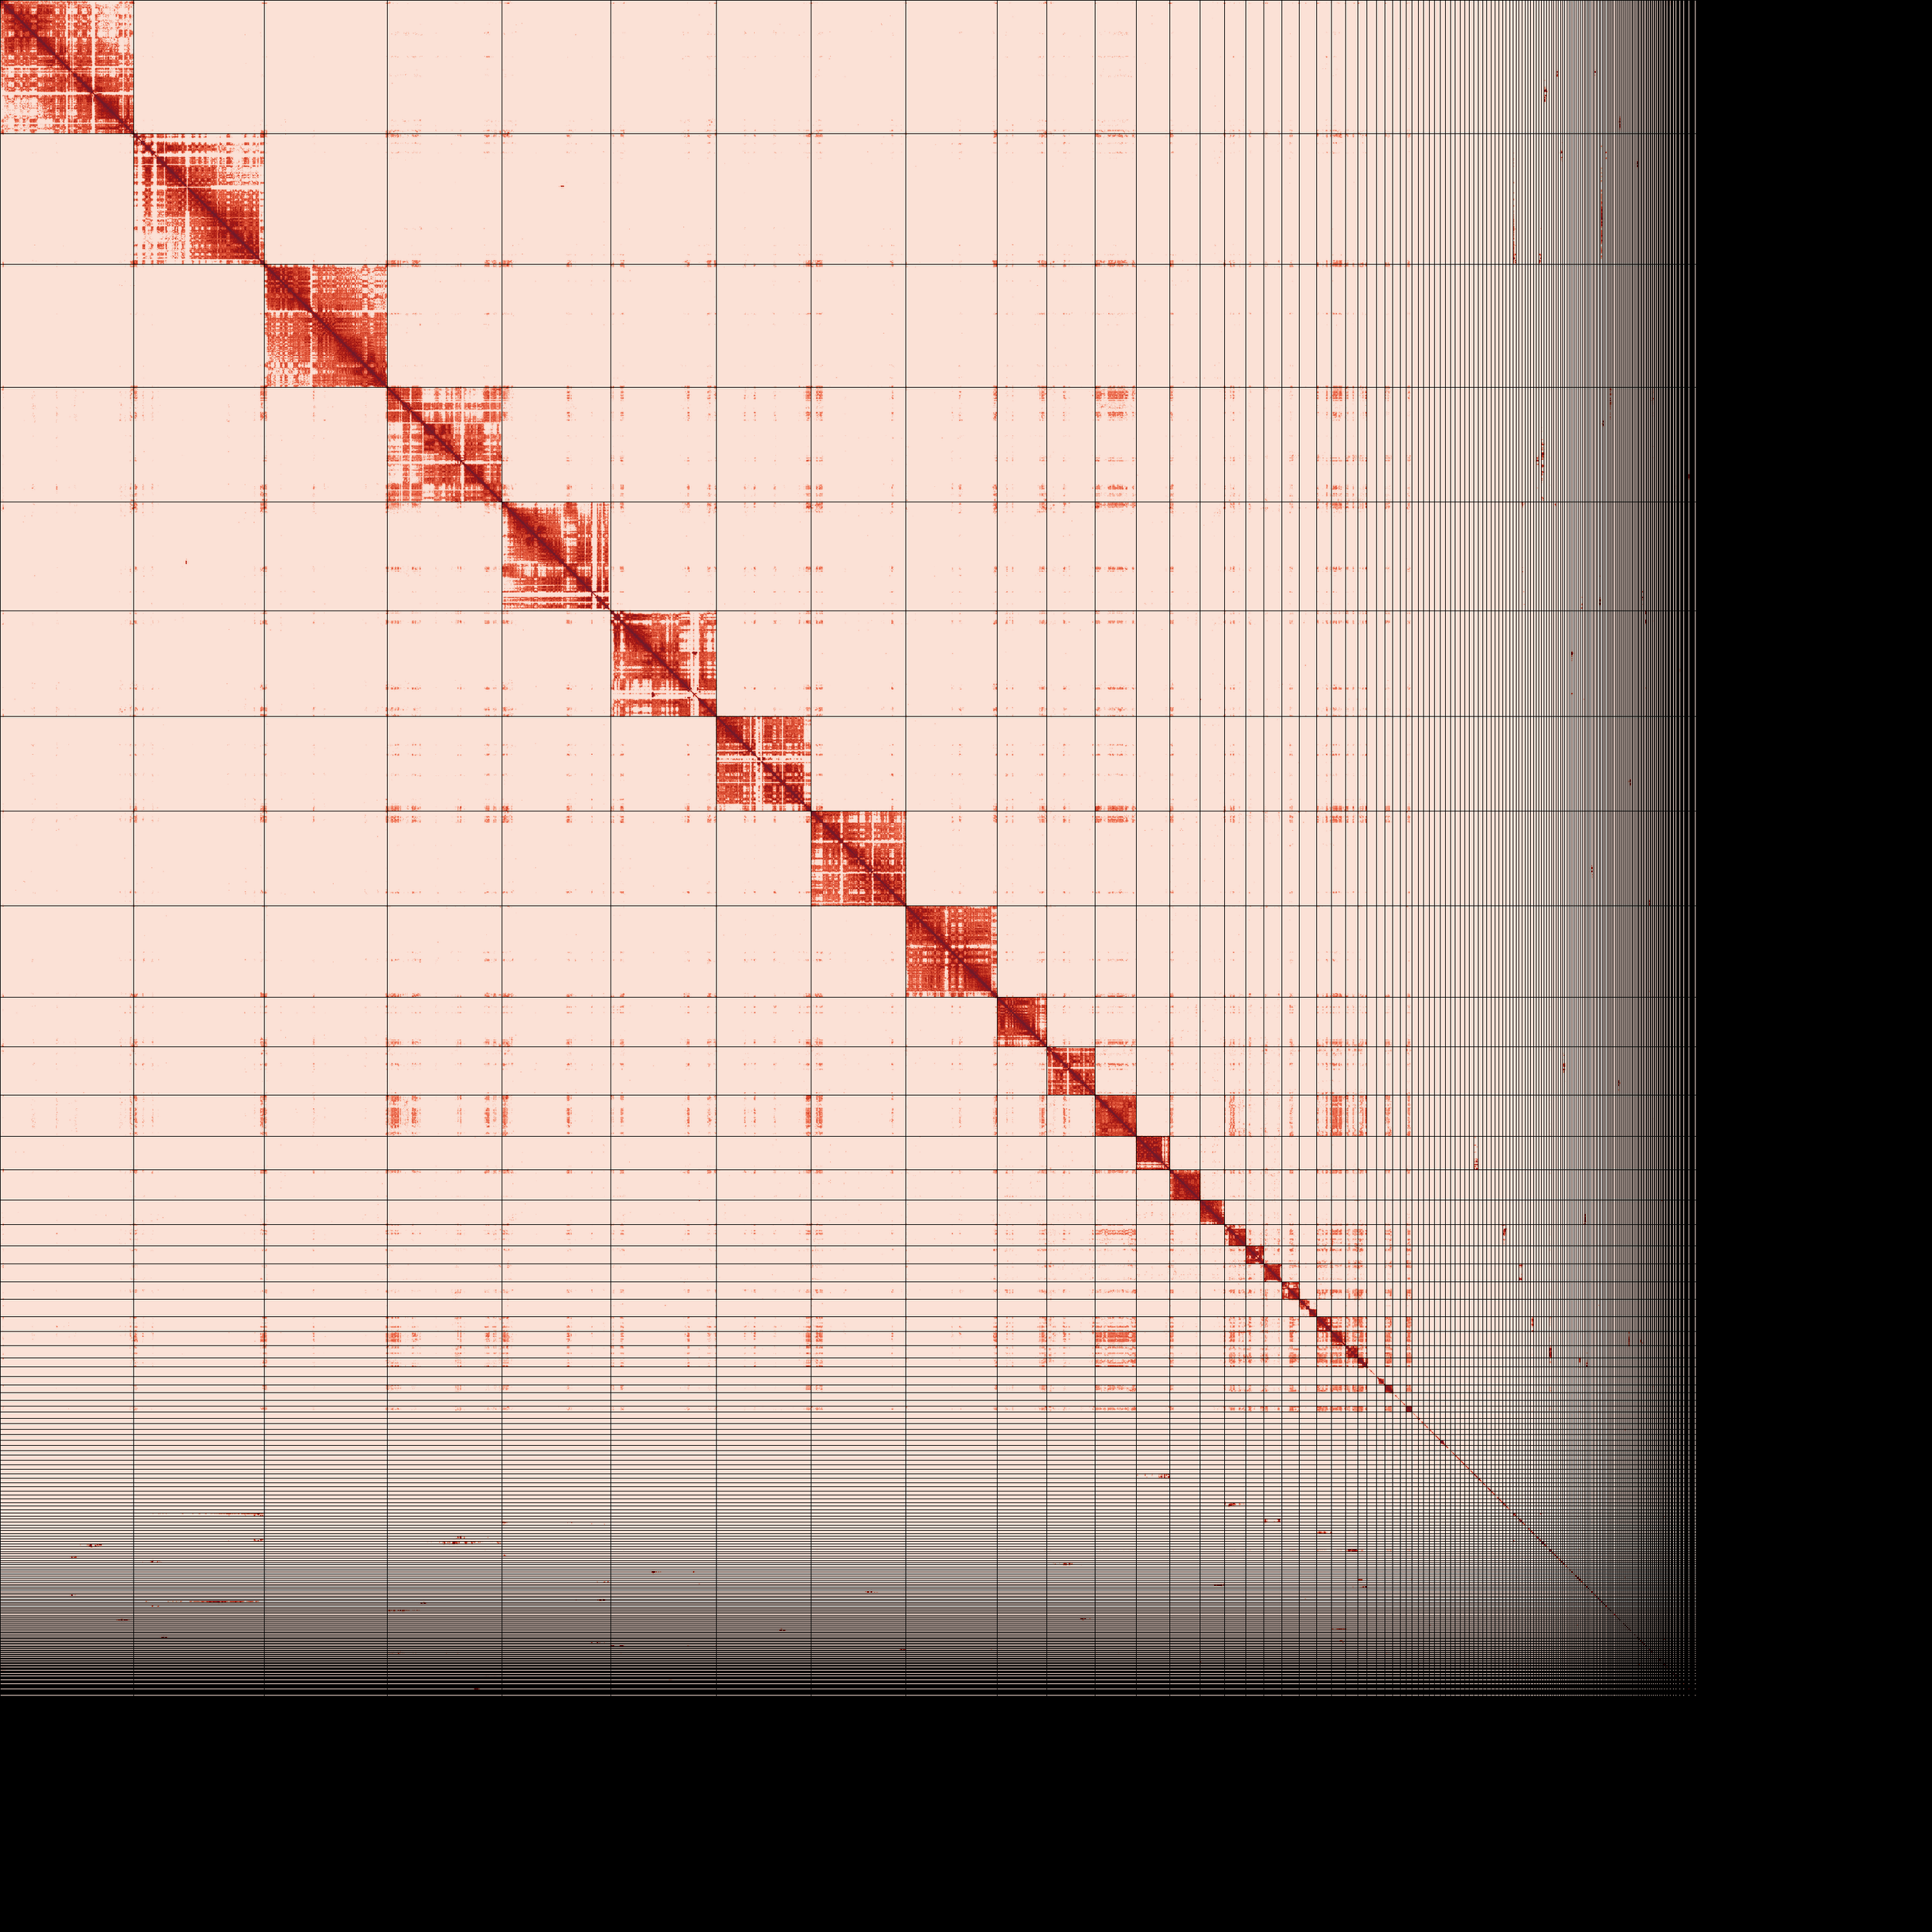
Primary and alternate assembly contiguous linear arrangement visualized as Omni-C contact maps (PreTextSnapShot). Darker areas represent regions of the genome that are close to each other in 3D space as identified by chromatin-proximity sequencing.
Authors
Erin R Voss , Merly Escalona , Oanh Nguyen , Mohan P A Marimuthu , Noravit Chumchim , Colin W Fairbairn , William Seligmann , Eric Beraut , Christopher J Conroy , James L Patton , Rauri C K Bowie , Michael W Nachman